• Find *.ccl file. It should be present in specified output directory path.
 |
B.7 Code Coverage
There are two panes in the Code Coverage window:
• Hierarchy pane
• Source Code or Details tab
B.8 Code Coverage
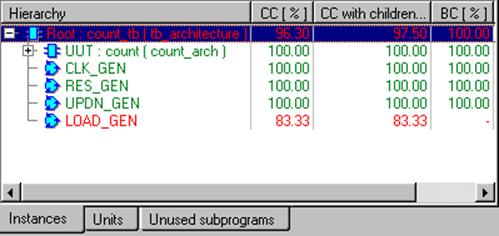
• The Instances tab in the left pane shows the units of the design and Code Coverage statistics for each item in the tree. Depending on mode selected design herarchy may be reflected in this pane (additonal tab Instances appears)
• The icon captions in the design hierarchy tree can be either green (for 100% covered items) or red (for items that are not fully covered)
• The Units tab in the left pane shows Code Coverage statistics for all units used in the design, irrespective of their position in the hierarchy tree.
B.9 Code Coverage
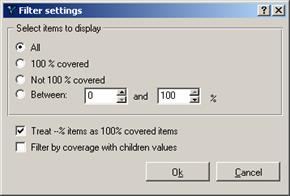
In the Main Tool Bar you can select which instantiations should be displayed
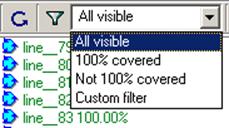
You can choose whether all instantiations should be displayed, instantiations with 100% executed statements, or instantiations with statements not executed or use a custom filter.
To customize visibility, you should use the Filter dialog box.
B.10 Code Coverage
The source code of selected module is displayed in the Hierarchy window.
Executed statements are displayed in green color. The number of execution times is also displayed.
Statements that were not executed are in red.
B.11 Code Coverage
The Detailstab allows you to present the results of the coverage in graphical form. The participation and visual presentation of executed and not executed lines is shown in the form of the pie charts.
The first chart (Results for selected instance) shows the amount of executed lines for a selected instance in green color and the amount of not executed lines for a selected instance in red color.
The second chart (Results for selected instance and all its children) shows the amount of executed lines for a selected instance with children in green color and the amount of not executed lines for a selected instance with children in red.
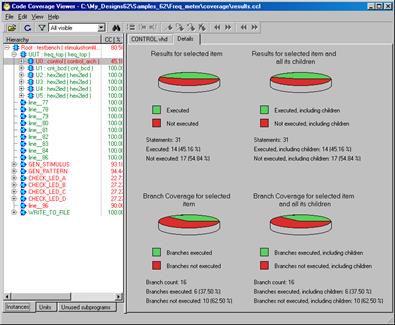
The picture shows sample results for the FREQ_METER design
Appendix C
Importing
Foundation Designs
C.1 Importing Foundation Designs
Active-HDL allows you to import Foundation design. It gives you a big advantage because you are able to make HDL level simulation, debug your design and make implementation into any devices.
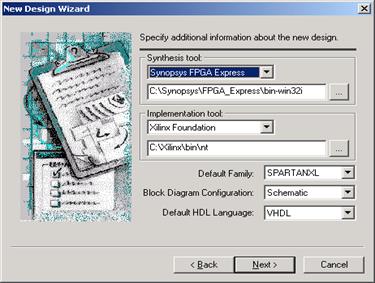
In the first step, the new Active-HDL design should be created. Your Foundation design will be imported during creation process of the new Active-HDL design. To create the new design, go to the Files menu and select Design optionin Newsubmenu. This will invoke the New Design Wizard.
In the New Design Wizard window, perform the following steps:
• Select Import a design from Active-CAD option
• Press Next button to proceed to the next window
C.2 Importing Foundation Designs
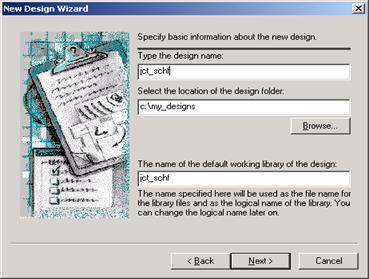
Now you have to select the Foundation Design
• Press the select button
• Select the JCT_SCHF design
It is located in Xilinx Foundation sample designs folder
• Press the Open button
• Press the Next button
 |
C.3 Importing Foundation Designs
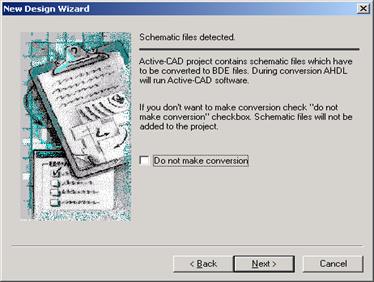 The conversion window appears
• Press the Next button
• Press the Next button
• Press the
Next button
• Press the
Finish button
 |
C.4 Importing Foundation Designs
The import report will be saved in the ProjectImport.htm file.
There are also links to more detailed reports.
 |
C.5 Importing Foundation Designs
Уважаемый посетитель!
Чтобы распечатать файл, скачайте его (в формате Word).
Ссылка на скачивание - внизу страницы.