• ![]() Trace out - executes as many HDL statements as are required to
complete the execution of a subprogram. If subprograms are nested, the command
completes the execution of the innermost subprogram only.
Trace out - executes as many HDL statements as are required to
complete the execution of a subprogram. If subprograms are nested, the command
completes the execution of the innermost subprogram only.
• ![]() Trace over transition - executes as many HDL statements as are required to
perform a transition between states.
Trace over transition - executes as many HDL statements as are required to
perform a transition between states.
4.6 Code Tracing
To trace the code, click the trace buttons. The currently executed line is highlighted in yellow.
To improve source debugging, you can also set multiple:
• code breakpoints
• signal breakpoints
Note: The breakpoints stop the debugging process.
4.7 Simulation Breakpoints
Breakpoints allow you to stop the verification process when some desired condition(s) occurred. All processes are suspended and signal values are displayed in the Watch window.
To set a breakpoint, hit the F9 key or choose the Toggle Breakpoint option from the pop-up menu.
NOTE: The HDL Editor allows inserting breakpoints only in these lines that contain appropriate constructs, e.g. statements containing assignments, expressions, etc.
4.7 Ref.A Breakpoint Editor
The Breakpoint Editor allows manual toggling of the breakpoints. Moreover, you can add signal breakpoints on signals that you want to trace.


• You can select which breakpoints are to be while debugging the design.
• You can also set the signal breakpoints by specifying the follwoing conditions:
• Event
• Transaction
• Value
4.8 State Machine Code Debugging
To trace state machines, you need to generate their corresponding HDL code. The State Machine Editor highlights the currently active state in yellow.
• All the Trace commands are active during the debugging. Therefore, you can trace an execution of any statement in the HDL code and observe its influence on the model’s behavior.
• The Trace over Transition option executes the source code to the point where the next transition takes place.

4.9 Verifying Results
You can use
additional tools while tracing HDL code that will help you to verify the
design’s overall responses.
Active-HDL comes with the following interactive windows:
• Watch – displays the current signal, variable, or generic value
• List – displays results in a tabular format
• Waveform – displays graphical results in a form of signal waves
• Processes – displays the process status in the current simulation cycle
• Call Stack – displays a list of sub-programs being currently executed and their parameters
• Memory View – displays the memory contents
• Advanced Dataflow - displays flat or hierarchical interconnects of a design
Note: You can open each window by choosing an appropriate option from the View or File | New menu.
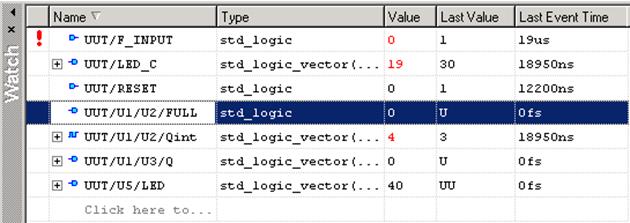
4.10 Watch Window
To find the last or current signal value, you may use the Watch window. The Watch window displays values of selected signals (including ports) and variables.
The window is divided into several columns that show:
• names
• types of the selected objects
• current value
• last value
• event
• last event time
Note: The red exclamation mark means that an event occurred on the marked signal in the current simulation cycle.
4.11 Adding Signals to Watch
All signals viewed in the Watch window can be dragged and dropped from the Design Browser window. You can also drag a signal name from the HDL source code itself.
• To add the signal from the HDL code, highlight the signal name.
• Drag the signal to the Watch window.
Note: You can change signal display options in the Preferences window by choosing the Display options from the pop-up menu.
4.12 List Window
The List windowdisplays all results in a tabular form.
(This window is used only as a viewer of simulation results)
Each signal is represented by a column with corresponding event times. The window can display signal values in two ways:
Уважаемый посетитель!
Чтобы распечатать файл, скачайте его (в формате Word).
Ссылка на скачивание - внизу страницы.