When your simulation is finished, you can run the Code Coverage Viewer from the Tools menu in Active-HDL.
All data gathered by Code Coverage can be presented in a graphical and textual form in the Code Coverage Viewer window.
![]()
7.4 Code Coverage
To load the Code Coverage data collected during simulation run:
• Select Open… from the File
menu or use ![]()
button in the main toolbar.
• Find results.ccl file. It should have been created in previously specified path.
7.5 Code Coverage
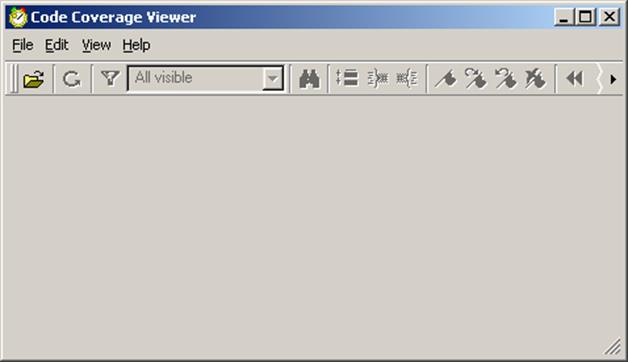
There are two panels in the Code Coverage Viewer window:
• Hierarchy pane - displays the hierarchical structure of the design
• Source Code /Details pane
 |
|||
|
|||
Hierarchy
pane
7.6 Hierarchy Window
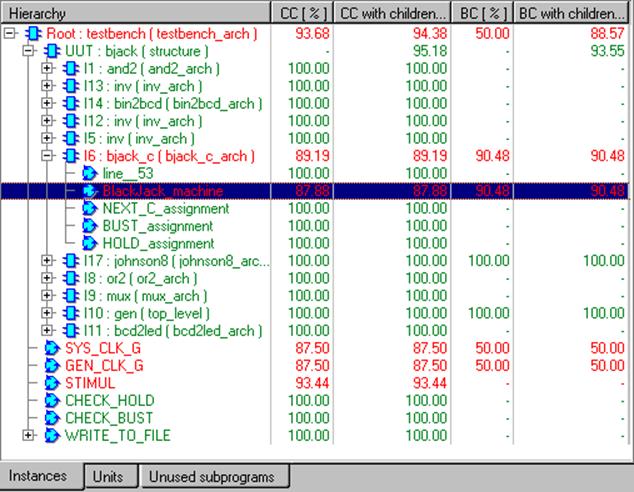
The Instances tab in the left pane shows the elaborated structure of the design and Code Coverage (CC) and Branch Coverage (BC) statistics for each item and its children in the design tree.
• The icon captions in the design hierarchy tree can be either green (for 100% covered items) or red (for items that are not fully covered).
• The Units tab in the left pane shows Code Coverage statistics for all units used in the design, irrespective of their position in the hierarchy tree.
7.7 Hierarchy Window
You can select
which instantiations should be displayed using list-box or ![]() button in the Main Tool Bar.
button in the Main Tool Bar.
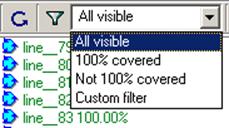
You can choose whether all instantiations should be displayed, instantiations with all statements executed, or instances with unexecuted statements or use customized view.
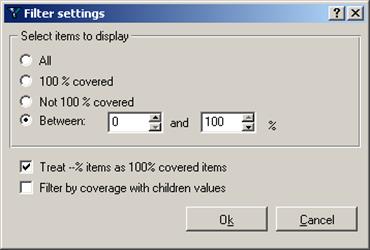
To customize visibility, you use the Filter dialog box.
7.8 Source Code Tab
The source code of module selected in Hierarchy pane is displayed in the Source tab.
Executed statements are displayed in green color. The number of executions is also shown to the left of corresponding line.
Statements that were not executed at all are in red.
Executed
statements
Not
executed
statements
7.9 Details Tab
The Detailstab allows you to present the results of the coverage in graphical form. The participation and visual presentation of executed and not executed lines is shown in the form of the pie charts.
The first chart (Results for selected instance) shows the amount of executed lines for a selected instance in green color and the amount of not executed lines for a selected instance in red color.
|
|
|
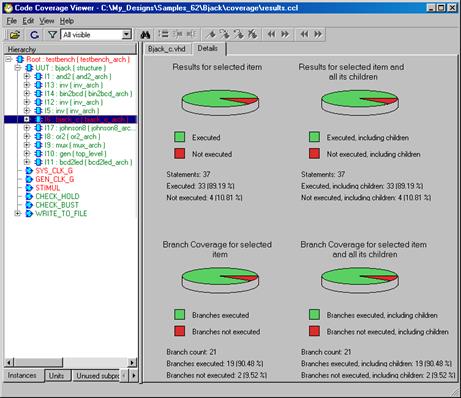 The second chart (Results for
selected instance and all its children) shows the amount of executed lines
for a selected instance with children in green color and the amount of not
executed lines for a selected instance with children in red.
The second chart (Results for
selected instance and all its children) shows the amount of executed lines
for a selected instance with children in green color and the amount of not
executed lines for a selected instance with children in red.
|
7.10 Merge Code Coverage Data
It is possible to verify efficiency of your test suite using the Code Coverage Merge feature. You can combine the data gathered for individual simulation runs and see how good your test set is.
7.11 Merge Code Coverage Data
To combine Code Coverage data obtained in two separate simulation sessions, you need to issue the following command in the Console Window.
cc merge -merge_branches UUT UUT -dir $DSN\coverage1
-dir $DSN\coverage2 -dest $DSN\coverage_merged
This will merge data starting from the specified instances (UUT). This is particularly useful when combining data from simulation of two different top-level units containing the same tested units. Alternatively, the –merge_hierarchies switch will combine whole trees, if top-level units have same name and structure.
Уважаемый посетитель!
Чтобы распечатать файл, скачайте его (в формате Word).
Ссылка на скачивание - внизу страницы.