• For all simulation cycles executed for the specified time step.
• Only for the last simulation cycle within the specified time step.
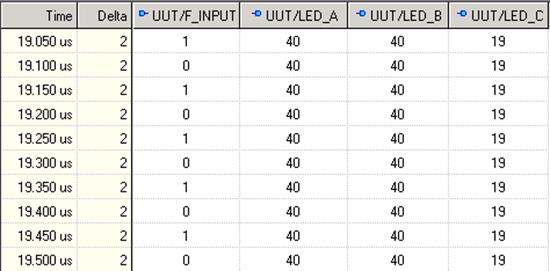
Note: You can toggle the delta display using the button.
4.12 Ref.A Delta Cycle Handling
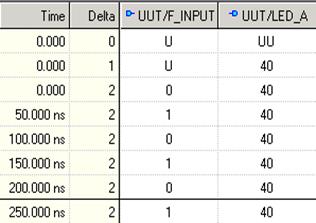
The Active-HDL simulator uses delta cycles to simulate the design.
A delta time is an infinitesimally small amount of time that represents a time greater than zero, but it is zero when added to a discrete amount of time. Thus, if a signal assignment is made at time "100ns + 1 delta time" and the model discrete delay is 10ns, the new signal value is assigned at 100ns + 10ns + 0 delta time = 110ns. This is because the 1 delta time * 1 = 0ns.
The number of delta delays reflects the number of events that take place in particular simulation cycles.
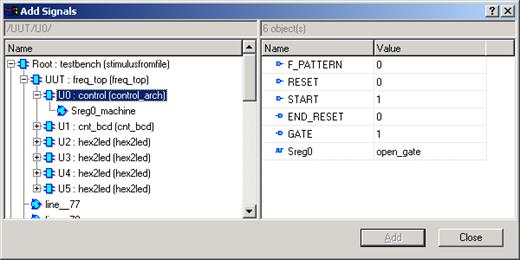
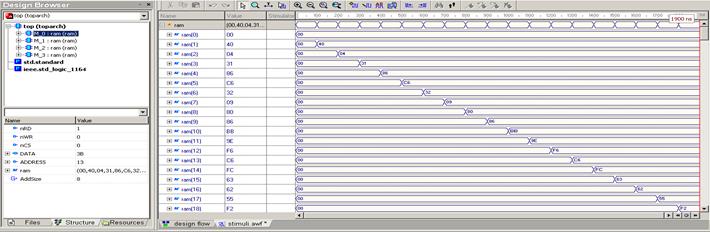
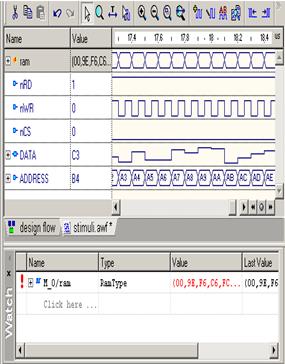
4.13 Adding Signals to List
All signals viewed in the List window can be dragged and dropped here, from the Design Browser window. You can also use the Add signals window.
• To add the signal from the Design Browser, select the entity in the Structure tab and drag it to the Watch window.
• To add signals using the Add Signals
window, click the
button and select the signals. Close the window by clicking the Close
button.
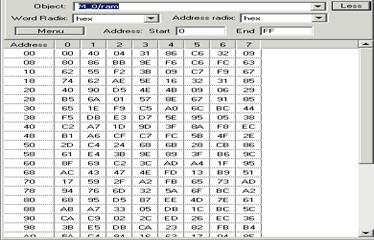
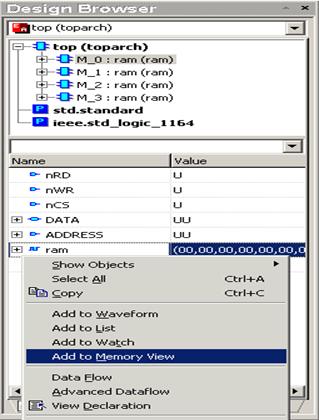
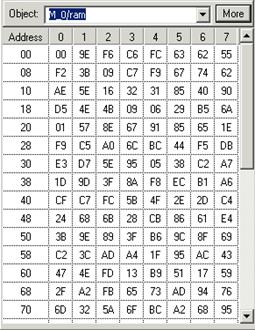
4.14 Memory View
The Memory View window is a debugging tool that has been designed to display the contents of memories defined in a design (e.g. objects of the two-dimensional array type).
The Memory View window allows you to view objects as if they were memory cells. The memory contents are presented in the window as a table of the defined number of columns and rows.

4.14 Using Memory View
• Open Memory View window using the
button  on the main toolbar or use Memory
View option from the File | New menu after simulation has been
initialized.
on the main toolbar or use Memory
View option from the File | New menu after simulation has been
initialized.
• Select the desired object on the Structure tab of the Design Browser and use pop-up menu option Add to Memory View
• You can also use drag n’ drop technique to add objects displayed in Waveform Editor, Watch etc.


4.15 Processes Window
The Processes window displays a list of processes in the elaborated model along with their current status. This window is available only while the simulator is running.
Each concurrent statement that is modeling a sequential process is represented in the window. There are:
– process statements
– concurrent signals assignment statements
– concurrent assertion statements
– concurrent procedure call statements
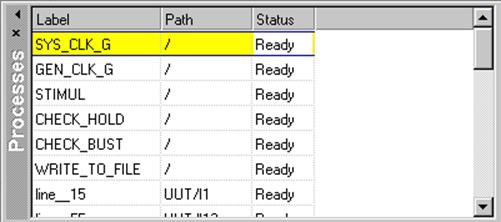
Note: For processes without explicit labels, the compiler generates default labels that show the line number of the source file in which a process is located (e.g., line__15).
4.16 Processes window
A process listed in the Process window can have one of the following statuses:
• Ready - indicates that the process is scheduled to be executed within the current simulation cycle.
• Wait - indicates that the process is suspended and is waiting to be resumed.
The Processes window can show either:
• All processes in the selected region of the elaborated design, irrespective of their status in the current simulation cycle.
• Only active processes in the selected region of the elaborated design (those scheduled to be executed within the current simulation cycle).
Уважаемый посетитель!
Чтобы распечатать файл, скачайте его (в формате Word).
Ссылка на скачивание - внизу страницы.