• Syntax Checking - performed with every Compile command
• Code Tracing - HDL code is executed either statement-by-statement or traced by processes, subprograms, and procedures
• Value Verification - variable values are displayed in additional Watch, List, and Memory View windows
• Activity Status – active processes are displayed in the Processes window
• Off-line Simulation – the Post Simulation Debug mode allows observing simulation results saved to a file after the simulation has been finished
• Design Interconnects - statements, port maps, connections, instances are displayed in the Advanced Dataflow window
• Xtrace – helps to find the unknown values throughout the design
4.1. Debug Preparations
Before you start debugging a source code, you have to perform some initial procedures:
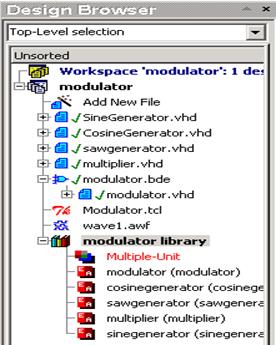
• Set up a design and
add all required files.
• Generate an HDL description
for any block diagram
and state machine.
• Compile source files into
a working library to perform
syntax check
• Start debugging the source code
4.1 Ref.A Debugging Restrictions
Active-HDL allows you to debug the source code of your design that has been compiled into a working library.
However, the components stored in some standard libraries provided with Active-HDL software do not contain the original source code.
Instead, they contain the headers for the pre-compiled code that you will not be able to debug.
4.2 Syntax Checking
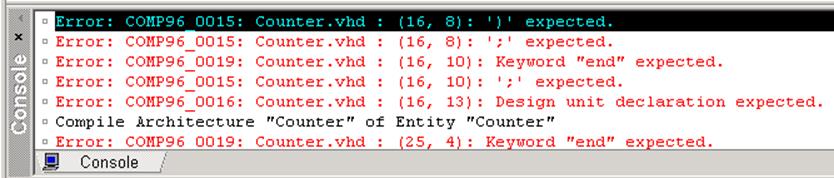
After you execute the Compile command and errors occur, a list of errors is displayed in the Console window.
Each error is displayed with additional information:
• name of the source file
• internal error number
• line & column number location of the error in the code
• a short description of the error
4.3 Searching for Errors
The Console window is tightly integrated with the HDL Editor.
• Double-clicking any error message will take you directly to the HDL Editor window with the source of an error.
• The line is also underscored with a red wavy line and a red marker is placed to the left of the line.
• Resting the pointer over the underscored line for a second, pulls up a tooltip with error descriptions.
• We can review the history of issued commands in the Console window by using the navigation keys (the up or down arrow key). They can be recalled very quickly and then re-executed by pressing Enter.
4.4 Preferences
The Preferences window allows you to customize the way the debugger works:
• Select one of the two options for tracing state machine code:
– trace the original state machine
– trace HDL code generated from a state machine
• Separate component instances view
• Set the display options for vectors and numbers
4.5 Code Tracing
You can trace the HDL source code statement-by-statement. There are four functions that allow you to trace the code:
• ![]() Trace into - executes a single HDL statement. If a subprogram
call is encountered, the execution descends into the subprogram body.
Trace into - executes a single HDL statement. If a subprogram
call is encountered, the execution descends into the subprogram body.
• ![]() Trace over - executes a single HDL command. If a subprogram call
is encountered, the statements contained within the subprogram body are
executed in a single step.
Trace over - executes a single HDL command. If a subprogram call
is encountered, the statements contained within the subprogram body are
executed in a single step.
Уважаемый посетитель!
Чтобы распечатать файл, скачайте его (в формате Word).
Ссылка на скачивание - внизу страницы.