Macro run_full_mode.do gathers the full data for all ports of the “UUT” unit:
toggle -toggle_type full -posedge "01 L1 Z1" -ports /UUT/*
7.20 Toggle Coverage - Full mode
Using Full mode you can verify whether proper edge has ever occurred on selected signals. In our example, the posedge has not occurred on LEDS(4), but the negedge did.
Signal Name Toggled Negedges Posedges
UUT/LEDS
[7] NO 0 0
[6] NO 0 0
[5] NO 0 0
[4] NO 1 0
[3] NO 1 0
[2] YES 1 1
[1] YES 1 1
[0] YES 1 1
7.21 Toggle Coverage – Activity mode
The Activity mode provides information on how many rising and falling edges happened on a signal while the signal was monitored.
The
last example run_activity_mode.do gathers the activity data for all output
ports.
Additionally, the XML format has been used:
toggle -toggle_type activity -xml activity_mode.xml
-out -rec /UUT/*
7.22 Toggle Coverage – Activity mode
Report for the last macro run_activity_mode.do shows in colors which signals have been toggled or not.
Additionally,
the summary data
could be useful for
statistic verification
and switch-power
optimization.

7.23 Toggle Coverage Viewer
The Toggle Coverage results can be viewed in the Toggle Coverage Viewer.
This tool is available in the
Active-HDL’s Tools menu
![]()

7.24 Toggle Coverage Viewer
To load the Toggle Coverage data collected during simulation run:
• Select Open… from the File menu or use
button in the main toolbar.
• Find toggle.xml file. It should have been created in the $DSN/toggle folder by default.
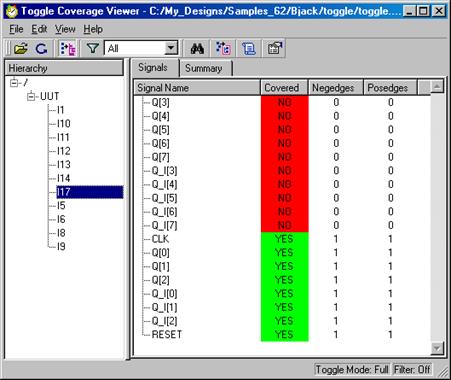
7.24 Toggle Coverage Viewer
By default the results are displayed in form of a flat list showing all signals and their hierarchical paths.
Signals that have not been properly toggled are displayed in red and the others in green.

Using the Show/Hide hierarchy browser button hierarchical mode can be enabled.
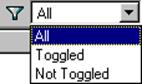
7.24 Toggle Coverage Viewer
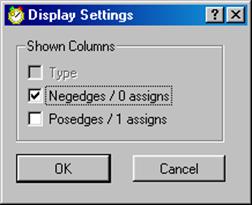
The view can be customized with filter that allows to display either all the signals, ones that have been covered and not covered only.
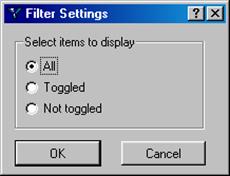
Also, the columns displaying the
number of Posedges, Negedges
and signal type (if such option has
been used) can be individually enabled.
Design Verification
Design Profiler
Course 8
8. Design Profiler
Design Profiler is a tool integrated within Active-HDL.
The Design Profiler provides insight into how the CPU is utilized during simulation. When the simulation is running, the profiling engine counts CPU ticks for each HDL statement. Profiling data is used to identify design units or code sections that put the greatest strain on the simulator.
8.1 Enabling Design Profiler
To enable Design Profiler you have to:
• Open the Design Settings window from the Design menu
• Select the
Code Coverage/Profiler tab
• Check the Profiler option
• Specify the name of the output file directory
• Press OK button
 |
8.2 Enabling Design Profiler
When a design simulation is initialized by a DO-macro file and you would like to use Design Profiler, you have to initialize simulation with following options:
asim -profiler -tbp_dest $DSN/profiler count
This will enable Design Profiler data gathering in default mode i.e. information will be collected for each unit. To distinguish each instance from the others, use syntax:
Уважаемый посетитель!
Чтобы распечатать файл, скачайте его (в формате Word).
Ссылка на скачивание - внизу страницы.