asim -profiler –profiler_hierarchy -tbp_dest $DSN/profiler count
Note: Please refer to on-line documentation for more details on asim command usage.
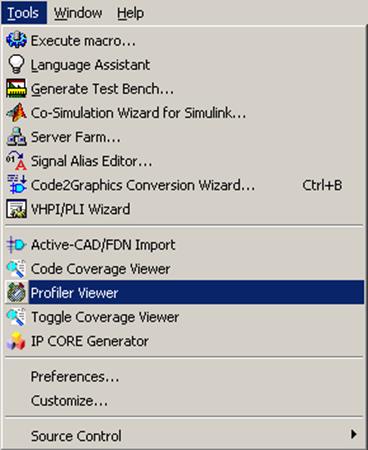
8.3 Invoking Design Profiler Viewer
When your simulation is finished, you can run the Design Profiler Viewer from the Tools menu in Active-HDL.
All data gathered by Design Profiler can be presented in a graphical or textual form in the Design Profiler Viewer window.
8.4 Design Profiler
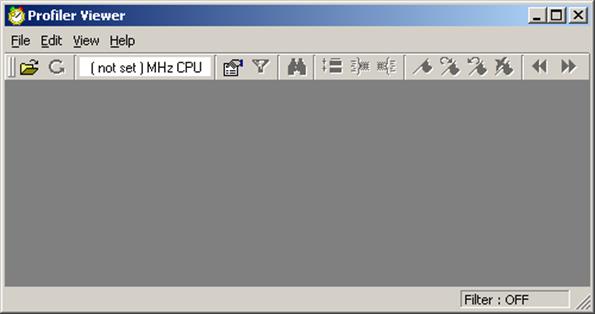
To load the Design Profiler data collected during simulation run:
• Select Open… from the File
menu or use ![]() button in the main toolbar
button in the main toolbar
• Find profiler.tbp file. It should have been created in previously specified path
8.5 Design Profiler
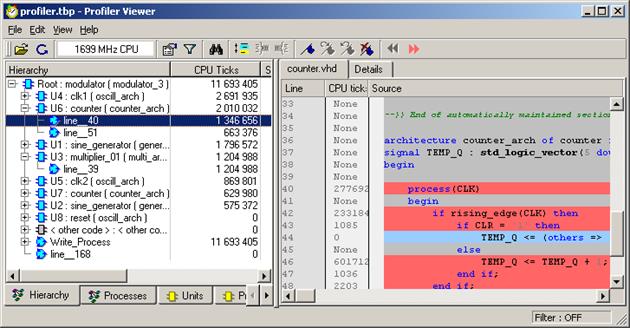
There are two panels in the Design Profiler Viewer window:
• Hierarchy pane - displays the hierarchical structure of the design
• Source Code /Details pane
|

|
 Details tab
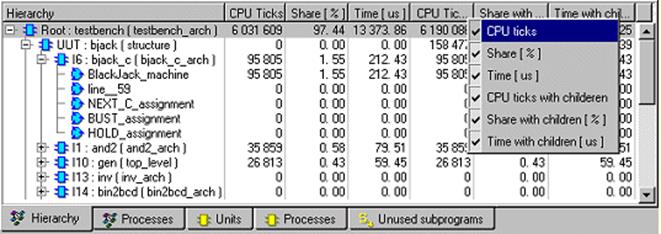
8.6 Hierarchy Window
The Hierarchy tab is divided into several columns:
Hierarchy: Shows an expandable tree with the design
structure.
CPU Ticks:Shows the number of CPU ticks that were required during
simulation to execute the code for the object highlighted in the hierarchy
tree.
Share [%]:Shows the share in the total simulation time for the object
highlighted in the hierarchy tree.
Time [us]:Shows time in microseconds that was required during simulation
to execute the code for the object highlighted in the hierarchy tree. Time
measurement is derived from the number of CPU ticks and the CPU
frequency.
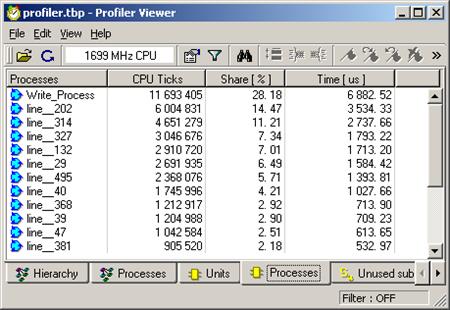
8.7 Hierarchy Window
Processes Tab (Hierarchical) shows data for individual processes in the design hierarchy.
Units tab in the left pane shows profiling statistics for all units used in the design, irrespective of their position in the hierarchy tree. If a given unit is instantiated more than once in the design, profiling data is merged for all instances of that unit.
Processes Tab (Flat): If the unit in which the process is defined is instantiated more than once in the design, profiling data is merged for all instances of the process.
The Unused Subprograms tab lists all subprograms that were not executed during the simulation process.
8.8 Hierarchy Window
You can select
which data should be displayed using list-box  or
or
 button in the Main Tool Bar.
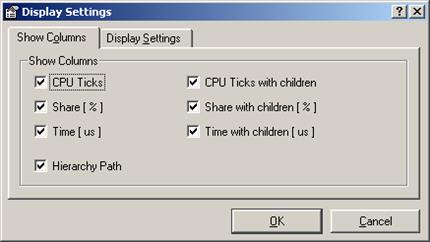
Display settings allows you to configure and customize view of gathered data by Design Profiler.
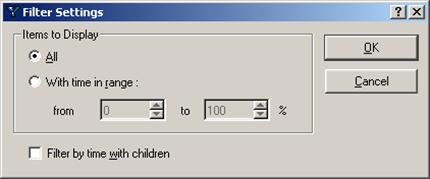
To customize visibility, please use the Filter dialog box.
8.9 Source Code Tab
The source code of unit or process selected in Hierarchy pane is displayed in the Source tab.
Executed statements are displayed in red color. The number of CPU Ticks is also shown to the left of corresponding line.
Statements that were not executed at all are shown in blue.
Non-executable lines or lines are displayed against a gray background.
Executed
statements
Not
executed
statement
8.10 Details Tab
The Details tab shows pie charts with profiling statistics.
The display on the Details tab is synchronized with the left pane of the Profiler Viewer. Selecting a unit or a process on the Hierarchy, Processes, or Units tab brings up the appropriate chart.
The first chart (Results for selected instance) shows statistics that do not account for objects nested further down in the hierarchy tree.
The second chart (Results for selected instance and all its children) is based on statistics that include nested objects. Accordingly, the time share for the top-level unit is 100%
Уважаемый посетитель!
Чтобы распечатать файл, скачайте его (в формате Word).
Ссылка на скачивание - внизу страницы.