Save results in TOP_FREQ.AWF file
8.9Simulating the Top Level
• Select Simulation | Restart Simulation from the menu
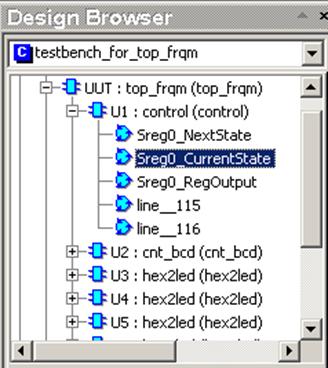
• Double click on the Sreg0_CurrentState process in the Structure tab in the Design Browser to open the state diagram for the Control machine
• Use the Trace Over Transition
button![]() to trace execution of the machine - each
time you click this button simulation advances to the next state of the Control
machine
to trace execution of the machine - each
time you click this button simulation advances to the next state of the Control
machine
8.10 Simulating the Top Level
The current state of the traced machine is always highlighted in yellow:
8.11 Simulating the Top Level
You can now play with some advanced simulation and debugging options. Several useful hints are listed below:
• You can set a breakpoint on the state in
the state diagram: right-click on the state and select the Breakpoint
option; the state with the breakpoint set has a double outline and the
appropriate message is displayed in the console when the breakpoint is
executed:
Stopped at breakpoint on signal "/UUT/U0/Sreg0" (Value condition :
OPEN_GATE)
• If you prefer to trace the state machine execution in the VHDL code instead of the state diagram, go to Tools | Preferences | Debugger, select State Machine in the Document Type field and Generated HDL code in the Trace Source Code In field
8.12 Simulating the Top Level
• Select View | Processes if you want to monitor processes execution. It may be useful if you have multiple instances of elements in your code and want to know which instance is currently active
• Remember to restart simulation before changing debugging sessions
• Select View | Processes if you want to monitor processes execution. It may be useful if you have multiple instances of elements in your code and want to know which instance is currently active
• Remember to restart simulation before changing debugging sessions
8.13 Accessing internal signals
• In the top_frqm_TB.vhd file,before the entity declaration add following library/use clauses
• Add following code in the architecture
8.14 Accessing internal signals
• Open top_frqm_TB_runtest.do and add following wave commands
wave UUT/U2/U1/Qint
wave U2U1Qint_SA
wave UUT/U2/U2/Qint
wave U2U2Qint_SA
• Save the macro file with signal_agent.do name and execute
• Please note how the contents of signals from the lower hierarchical levels are copied to their counterparts declared in testbench
Appendix A
Synthesis & Implementation Flow
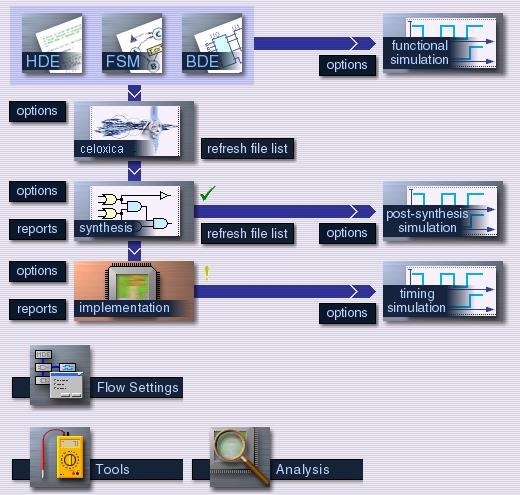
A.1 Synthesis & Implementation Flow
Synthesis and Implementation Flow was designed in order to run your synthesis and/or implementation tool from within one design and verification environment – Active-HDL.It allows you to set all necessary options for synthesis and implementation, choose between GUI and batch mode and finally, automatically adds output files to your design.
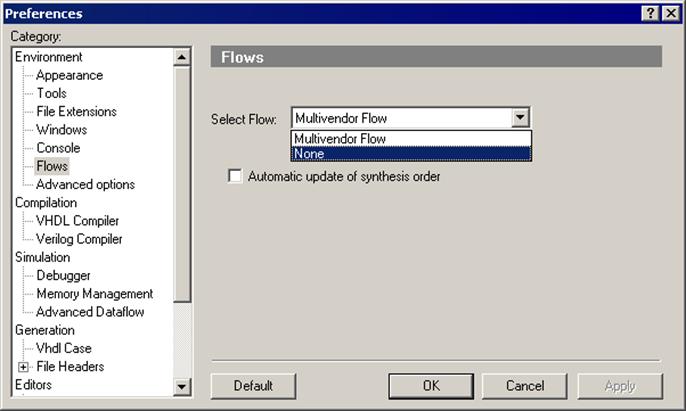
A.2 Synthesis & Implementation Flow
The flow can be enabled in the Flows category of the Preferences window (Tools | Preferences).
By default Multivendor Flow is enabled. This gives you access to all major synthesis and implementation tools on the market.
To disable Flow select None in Select Flow drop-down menu.
A.3 Opening Flows
• To open the flow, press the View Flow icon or select the Flow option from the View Menu.
A.4 Flow Configuration
At the beginning, you have to select synthesis and implementation tools.
• Press the Flow Settings button located on the Flow.
The Setting window will appear.
Уважаемый посетитель!
Чтобы распечатать файл, скачайте его (в формате Word).
Ссылка на скачивание - внизу страницы.