This tutorial shows how to start a debugging session and use the C/C++ debugging tools included in Active-HDL.
The tutorial is based on the following code samples:
• the datapath VHDL project (one of the samples delivered with Active-HDL and modified in Course 9)
• the dump_hierarchy VHPI application (created in Course 9)
If you do not have a copy of the modified datapath design with the vhpiuser_aldec.dll library, run the tutorial in Course 9 first.
10.2 Opening the Design
1. Choose Open Workspace/Design Explorer from the File menu. Then, double-click the datapath workspace icon located in the \Samples\VHDL_Designs folder.
The design includes a VHPI application created in Course 9.
The name of the VHPI .dll that will be loaded during the initialization of simulation is specified in VHDL code in the dump_hierarchy_vhpi.vhd file.
10.3 Compiling the Design
2. Compile the design using the Compile All command from the Design menu.
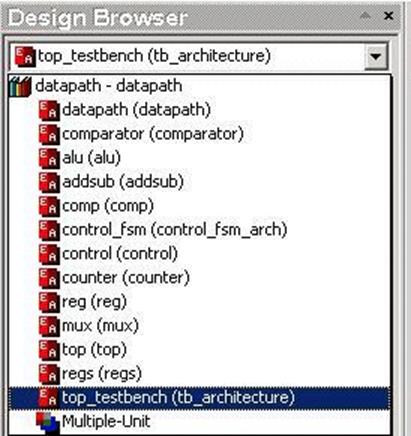
3. Use the list box in the Design Browser to set top_testbench (tb_architecutre) as the top-level unit.
10.4 Setting C Debug Options
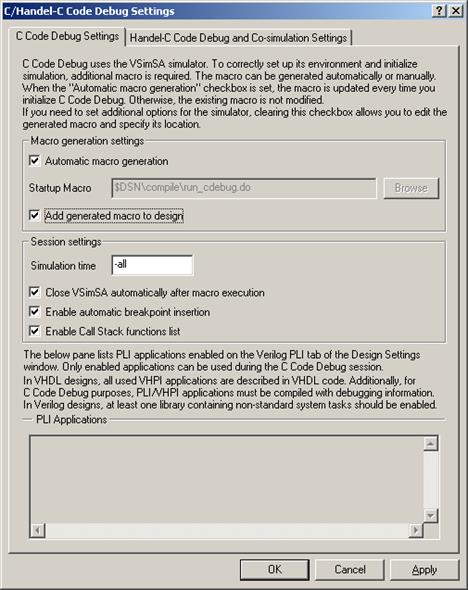
4. Choose C/Handel-C Code Debug Settings from the Design menu and review the options shown in the picture.
Click OK to close the window. The run_cdebug.do macro will be generated and added to the design.
10.5 Initialization of C Debugging
5. Choose Initialize C Code Debug from the Simulation menu. The simulator prompt will be displayed in an external window (rather than the graphical Console).
10.6 The C Code Debug Window
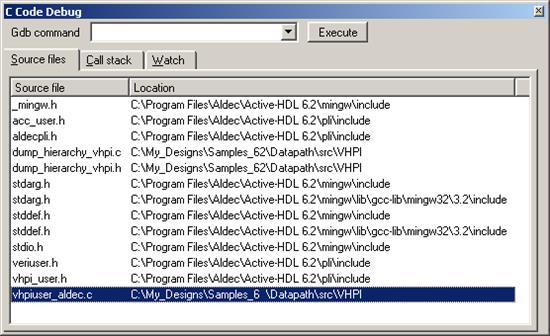
6. The C Code Debug window is displayed automatically after the initialization of simulation. Source files of the VHPI application are listed on the Source files tab.
7. The C Code Debug window is displayed automatically after the initialization of simulation. Source files of the VHPI application are listed on the Source files tab.
8. The C Code Debug window is displayed automatically after the initialization of simulation. Source files of the VHPI application are listed on the Source files tab.
10.7 Using Breakpoints
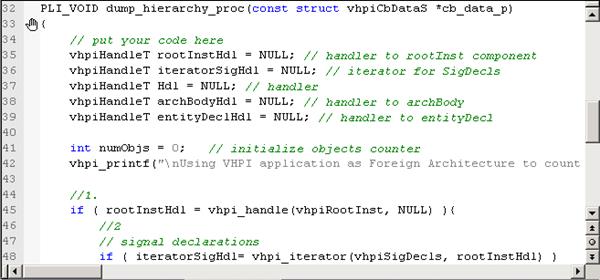
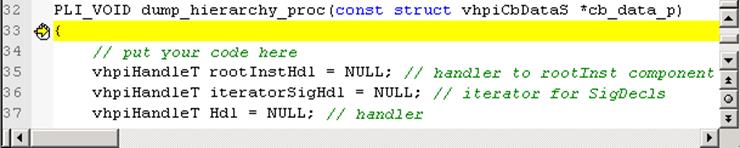
8. The editor displays C source code. Breakpoints are marked with the hand marker on the margin. You can set your own breakpoints with:
• Toggle Breakpoint command from the Simulation menu
or
• F9 key
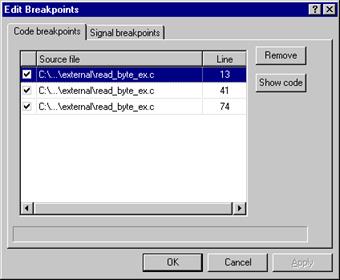
To review all breakpoints select Edit Breakpoints from the Simulation menu. This command displays the Edit Breakpoints dialog.
10.8 Executing gdb Commands
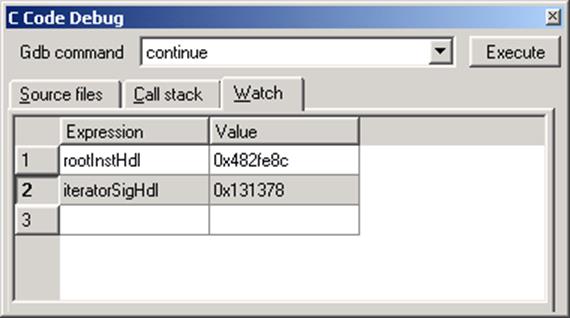
9. The C Code Debug window allows entering commands to the gdb debugger.
Type continue in the the Gdb command window and press the Execute button. The VHPI application will execute until suspended by a breakpoint.
You can
also use the Trace Into![]() , Trace Out
, Trace Out![]() and Trace Over
and Trace Over![]() buttons. Active-HDL will automatically translate
them into appropriate gdb commands.
buttons. Active-HDL will automatically translate
them into appropriate gdb commands.
10.9 Monitoring Variable Values
10.Values of C/C++ variables can be displayed on the Watch tab. To add an item double click on the empty cell in the Expression column and enter the name of the variable, for example iteratorSigHdl. Its value will be displayed in the Value column.
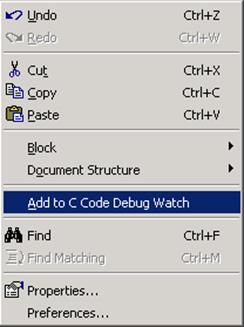
You can also click on a variable name in the editor and use the Add to C Code Debug Watch command from the pop-up menu.
Active-HDL
Server Farm
Course 11
Outline
1. Introduction
2. Advantages
3. Requirements
4. Installation
5. Architecture
6. Installing Servers
7. Using Server Farm
8. Using Server Farm with Design Flow Manager
11.1 Server Farm - Introduction
• Server Farm is an advanced tool working on the local network that allows users to schedule tasks and then execute them automatically on the selected computers available on the network.
Уважаемый посетитель!
Чтобы распечатать файл, скачайте его (в формате Word).
Ссылка на скачивание - внизу страницы.