A.16 Implementation
Now you can press the Implementation button to run the implementation process.
The new Implementation window will appear.
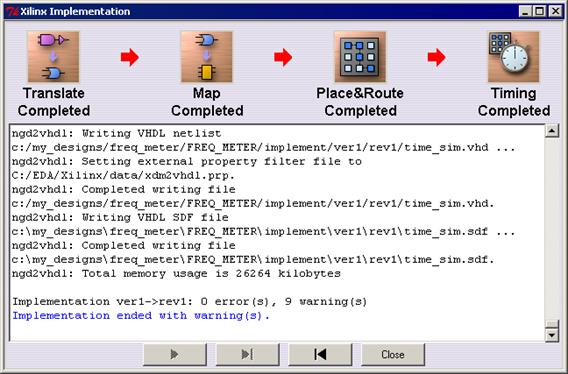 Implementation is working in batch mode
so you can use Active-HDL during implementation process.
Implementation is working in batch mode
so you can use Active-HDL during implementation process.
A.17 Implementation
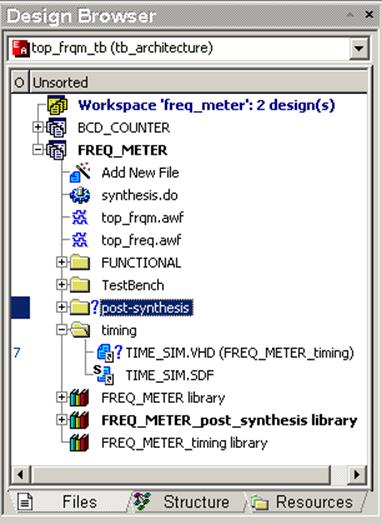
A new timing folder will be created in your design. Links to all simulation files generated by implementation tool will be located in this directory.
A new timing library will also be added to your design. This way you have separate libraries for each stage of the design flow.
A.18 Implementation
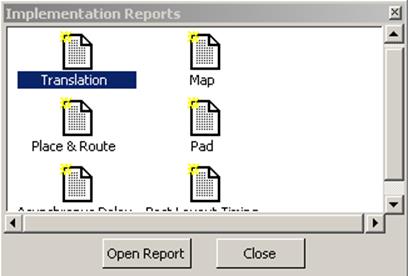
You have access to both synthesis and implementation reports under the Reports button near the Synthesis and Implementation buttons.
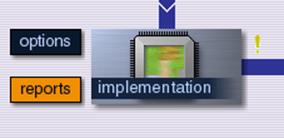
You can open each report in the text editor.
A.19 Timing Simulation
Now you are ready to perform timing simulation. Again you are able to use the same testbench as you did for behavioral and post-synthesis simulation.
Press the Options button located near the Timing Simulation button.
The Timing Simulation Options window will appear.
A.20 Timing Simulation
• Press the Select Design Flies icon
• Select IMPLEMENT/TIME_SIM.VHD
and
src/TestBench/top_frqm_TB.vhd
files
• Set proper files in order using arrows buttons
• Recompile files.
• Chose top_frqm_tb as top-level.
• Save DO-macro as timing_sim.do
• Press the OK button
A.21 Timing Simulation
A.22 Timing Simulation
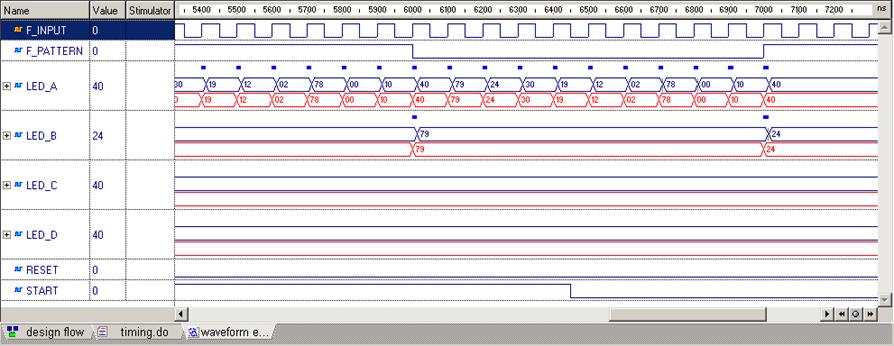
The Simulation
will be made. All results will be displayed on the created waveform. You can
now compare results with behavioral simulation. Use the Compare Waveforms
option form the Waveform menu or ![]() button.
button.
Open the TOP_FREQ.AWF waveform.
There are visible differences due to timing delays.
Appendix B
How to use
Code Coverage
B.1 Code Coverage
The Code Coverage is a tool integrated within Active-HDL.
It is a debugging tool that allows you to check how efficient your HDL source code is. It gives detailed information about the statements that are executed during design simulation. Code Coverage examines each executable statement and checks how many times it has been executed.
B.2 Code Coverage
• Open UpDown Design
This is 4-bits loadable counter design
• Compile count.vhd
This is the source code of the counter
• Compile count_TB.vhd
This is a testbench for the counter
• Open UpDown Design
This is 4-bits loadable counter design
• Compile count.vhd
This is the source code of the counter
• Compile count_TB.vhd
This is a testbench for the counter
B.3 Code Coverage
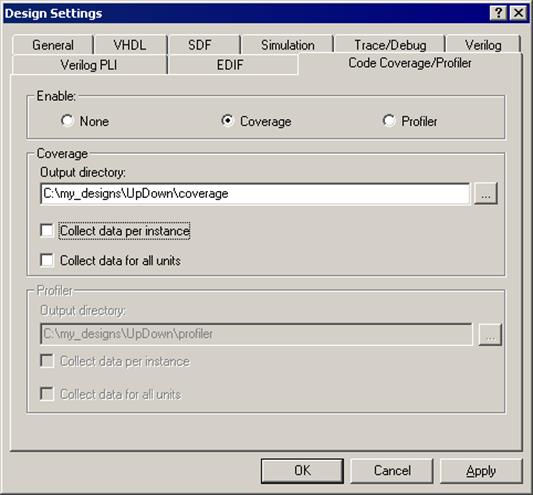
To enable Code Coverage you have to:
• Open the Design Settings window from the Design menu
• Select the Code Coverage/Profiler tab
• In the Enable section select Coverage radio button
• Specify the name of the output folder
• Press the Apply and OK buttons
B.4 Code Coverage
• Set count_tb(tb_architecture) as a top level
• Initialize simulation
• Run simulation for 2000 ns
• End simulation
 |
B.5 Code Coverage
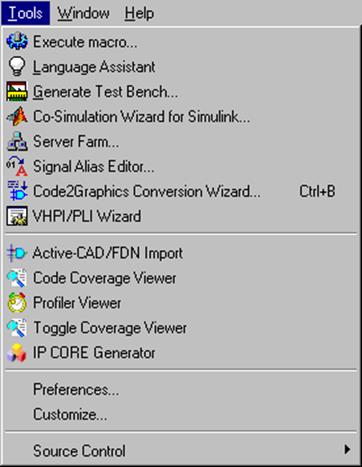 When
your simulation is finished, you can run the Code Coverage Viewer
from the Tools menu in Active-HDL.
When
your simulation is finished, you can run the Code Coverage Viewer
from the Tools menu in Active-HDL.
B.6 Code Coverage
To load the Code Coverage data:
• Select Open… from the File menu
Уважаемый посетитель!
Чтобы распечатать файл, скачайте его (в формате Word).
Ссылка на скачивание - внизу страницы.