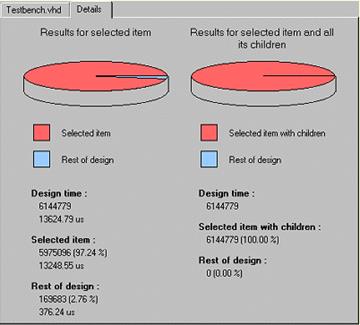
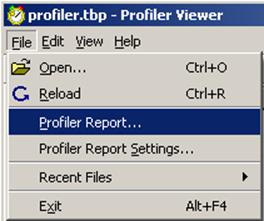
8.11 Design Profiler Report
The Design Profiler provides also possibility to generate a custom report file from gatered data.
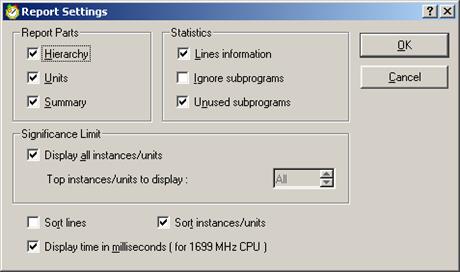
Using Profiler Report settings you can easily set interesting data which should be pasted to the report file.
Design Profiler Example
profiler_example
Project
8.12 Preview
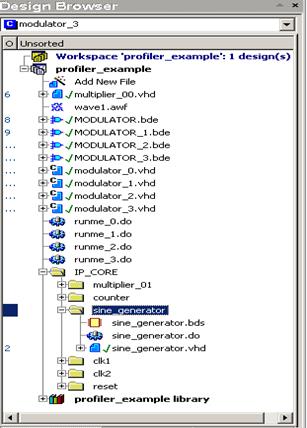
Project functionality based on modulator sample installed with Active-HDL. The top level – modulator contains two sine generators (oscillator + counter + main sine generator) and multiplier module based on IP Core Generator.
8.13 Contents
Design includes
four architectures of Modulator entity top-level and four configurations to
invoke simulation with proper one.
The IP_Core subfolder contains used modules from
IP Core Generator.
Additionally, for each example the proper macro file has been provided. This
way, to verify each case you have to invoke the proper macro.
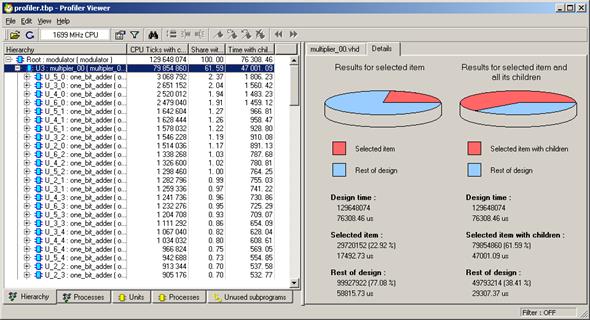
8.14 Modulator architecture
In this case as a multiplier module a fully synthetizable unit containing muxes and adders has been used. After execution “runme_0.do” macro you can see that this component and its subcomponents takes over 70% of simulation execution time.
8.15 Modulator_1 architecture
To provide better
performance the multiplier unit has been replaced by multiplier_01. The new
unit has the same functionality but its architecture is much simpler:
”Q<=A*B”.If you execute the “runme_1.do” macro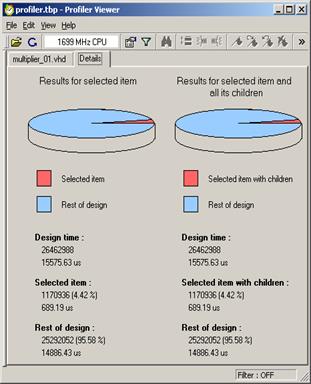
you can easily find difference: the CPU
usage for multiplier unit has been
drastically decreased - about 10 times!
8.16 Modulator_2 architecture
The “Modulator_2”
architecture includes additional process. This process writes all simulation
results to text file. After execution the “runme_2.do” macro
you can find that new process takes 58% of entire CPU time.
8.17 Modulator_3 architecture
The Write_Process has been optimized on “modulator_3” architecture. The sensitivity list has been reduced to the only one signal: “Q_int”. After execution “runme_3.do” you can verify the optimization effect.
Active-HDL Interfaces
Building VHPI Applications
C Compilation
Course 9
9. Building VHPI Applications
The VHPI interface provides a standard-compliant mechanism for connecting C applications to VHDL models simulated in Active-HDL. It allows development of applications such as:
• Code coverage tools
• Design traversals
• Behavioral C models
• Custom debugging environments
• C/C++ based testbenches
9.1 VHPI Tools in Active-HDL
All tools required to develop and debug VHPI applications are included in Active-HDL. Active-HDL includes:
• VHPI/PLI Wizard
• C/C++ Editor
• C/C++ Compiler (gcc)
• C/C++ debugger (gdb)
• Graphical front-end for gdb
VHPI applications can be compiled with any C/C++ compiler. However, gdb-compatible debug information is required for debugging VHPI applications in Active-HDL environment. (Debugging of C applications is described in course 10.)
9.2 Sample VHPI Application
This tutorial shows how to create a simple VHPI application. This application will be used in the datapath sample project delivered with Active-HDL. The application traverses the design hierarchy and counts the number of signals.
The tutorial covers:
• Using VHPI/PLI Wizard
• Entering C/C++ code in the editor
• Configuring C/C++ build environment
• Connecting VHPI application to the VHDL model (the datapath sample)
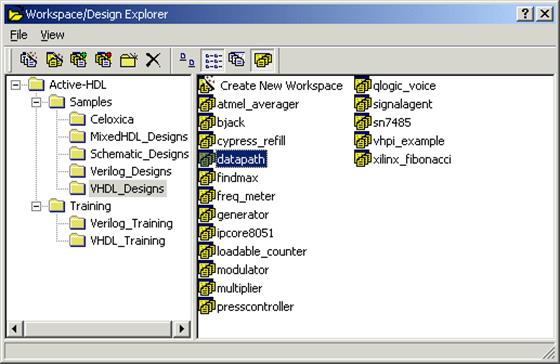
9.3 Loading VHDL Design
1. Choose Open Workspace/Design Explorer from the File menu. Then, double-click the datapath workspace icon located in the \Samples\VHDL_Designs folder.
9.4 Compiling the Design
2. Compile the design using the Compile All command from the Design menu.
3. Use the list box in the Design Browser to set top_testbench (tb_architecutre) as the top-level unit.
Уважаемый посетитель!
Чтобы распечатать файл, скачайте его (в формате Word).
Ссылка на скачивание - внизу страницы.