• Links to files with the icon are not generated by the WIZARD. These files are fixed and are the same for each WAVES testbench.
The rest of the files are specific for the design. The two most important files are:
• *_declaration.vhd - where the user can change some objects declarations important for simulation
• *_runtest.do - the simulation macro, which can also be customized by the user
E.12 WAVES Testbenches
• Open the count_TB_declaration.vhd file
• Find the following lines:
constant WND_BEGIN_DEFAULT: EVENT_TIME := 1 ps;
constant WND_END_DEFAULT: EVENT_TIME := 0 ps;
These define the time period when actual value should be compared with expected
value.
• Change the beginning value to 15 ns
constant WND_BEGIN_DEFAULT: EVENT_TIME := 15 ns;
• Change the end value to 50 ns
constant WND_END_DEFAULT: EVENT_TIME := 50 ns;
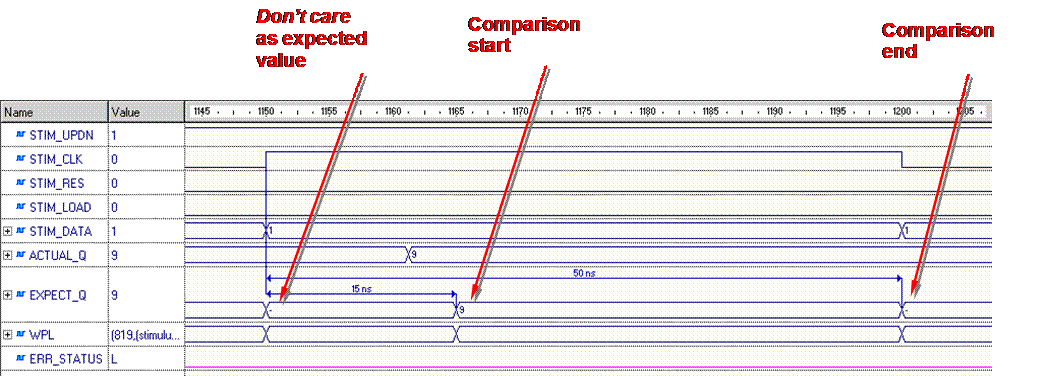
It means that comparison will start 15 ns after event and will be finished
after 50 ns
• Save changes
E.13 WAVES Testbenches
• Open Count_TB_runtest.do macro
change line
asim TESTBENCH_FOR_count
to
asim -sdftyp /UUT="$DSN\src\TIMING\TIME_SIM.sdf" TESTBENCH_FOR_count
• Save changes
• Close all files
• Execute Count_TB_runtest.do macro
when simulation will finish there will be message displayed in console window:
: NOTE : All vectors passed.
: Time: 2 us, Iteration: 1, TOP instance.
E.14 WAVES Testbenches

On the waveform, you can observe that comparison starts 15ns after any event and finishes after 50ns (with respect to STIM_CLK signal in this case). If the next event occured earlier, the comparison would be finished earlier too.
E.15 WAVES Testbenches
• End simulation
• Open the count_TB_declaration.vhd file once again
• Change beginning value to 10 ns
constant WND_BEGIN_DEFAULT: EVENT_TIME := 10 ns;
Because the delays during timing simulation have been longer than 10 ns, now
differences should be detected during simulation
• Save changes
• Close all files
E.16 WAVES Testbenches
• Execute Count_TB_runtest.do macro
once again
when the simulation finishes there will be a message displayed in the console
window:
: WARNING: Error on Q port.
: Time: 35 ns, Iteration: 1, TOP instance.
The value of ERR_STATUS signal will change to ‘1’.
• Execute Count_TB_runtest.do macro
once again
when the simulation finishes there will be a message displayed in the console
window:
: WARNING: Error on Q port.
: Time: 35 ns, Iteration: 1, TOP instance.
The value of ERR_STATUS signal will change to ‘1’.
Appendix F
How to create a
Diagram from HDL
F.1 Diagram from HDL
The Code2Graphics™ converter is a tool designed for automated translation of VHDL, Verilog EDIF source code into Active-HDL block or state diagrams.
Code2Graphics™ automatically detects whether your code is state machine or structural HDL netlist and converts it into state diagrams or block diagrams.
EDIF netlists can be only converted into block diagrams.
F.2 Diagram from HDL
•
Open the bj design containing several
VHDL files
Bjack.vhd is the top level VHDL netlist, and bjack_c.vhd is the
main state machine
Уважаемый посетитель!
Чтобы распечатать файл, скачайте его (в формате Word).
Ссылка на скачивание - внизу страницы.