Note: In addition, you can choose a region of the design whose processes you want to trace.
4.17 Call Stack
The Call Stack window is a debugging tool that displays a list of subprograms (procedures and functions) and variables being currently executed.
For each subprogram, the window displays the following information:
• Formal parameters along with their actual values.
• Variables, constants and files declared locally in subprogram
bodies along with their current values.

Note: The Call Stack window is available only while the simulator is running.
4.17 Ref.A Variables
You can change variable values in the Call Stack window for a current simulation run.
• To change a variable value,
click within the Call Stack
window.
• Now click the variable value
and type the new value.

Note: You can also change the variable value in the lower part of Design Browser following the same steps.
4.18 Dataflow
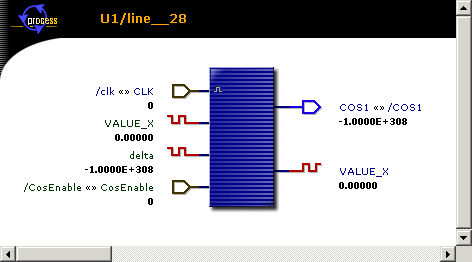
The Dataflow window provides a graphical view of signals flowing in and out of processes during the simulation.
The window provides two different views:
– with a process in the
center of the window
– with a signal in the
center of the window.
The window provides two different views:
– with a process in the
center of the window
– with a signal in the
center of the window.

Note: The Dataflow window is available only while the simulator is running.
4.19 Using Dataflow
To work with the data flow window, choose the Dataflow option from the View menu.
The process of following the signal path is based on two procedures:
• Click any signal name displayed in the Dataflow window to follow the signal path.
• Click the process symbol to follow the signal deeper into the design’s hierarchy.


4.20 Post Simulation Debug
Post-Simulation Debug is a powerful feature that enables users to trace the simulation results after simulation has been finished.
In order to enable this feature we do the following:
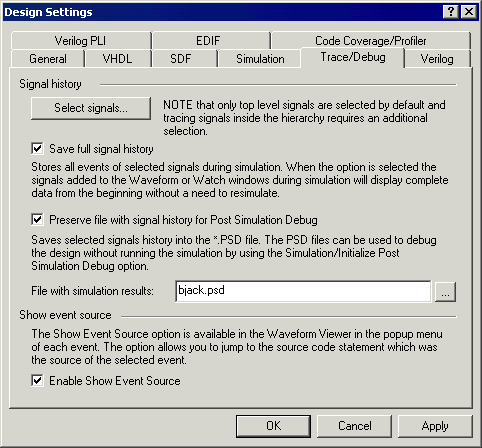
• Check the Save Full signal history box and select the signals for post-simulation debugging.
• Check Preserve file with signal history for Post Simulation Debug box on the Trace/Debug tab of the Design Settings window and specify the file in the File with simulation results field.

4.21 Post Simulation Debug
• Run the simulation for the desired time.
• To initialize simulation in the Post Simulation Debug mode, select the Simulation | Initialize Post Simulation Debug menu command
• The post-simulation data for the signals chosen will be saved in the *.psd file specified in the Design Settings window.
• Perform the post-simulation by running the simulation for the desired time.

4.22 Follow Object
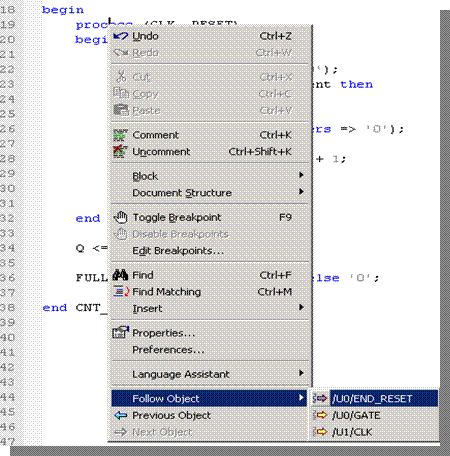
• The Follow Object option allows users to follow objects in the simulated design. An object to be followed can be a signal/net or process/always modeled by statements in the simulated design.
• To follow the selected signal/net or process you should:
• Initialize the simulation and then point to the signal/net name or process label (identifier).
• Right-click on object's identifier or on the keyword representing an object (e.g. if a process has no label).

4.23 Follow Object
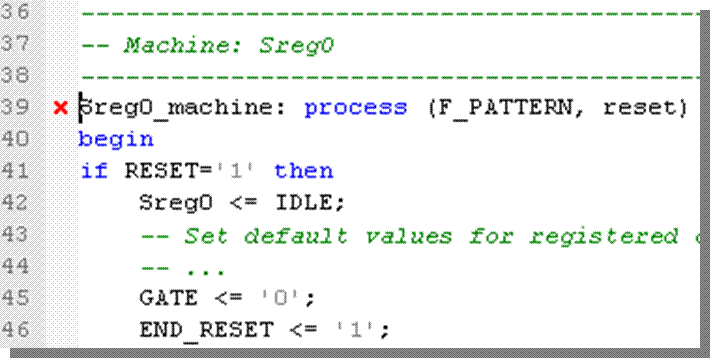
Choose the object that you want to follow from the Follow Object list. After it has been selected, an appropriate document window is open with the line of HDL code distinguished by the sign or with the highlighted object, e.g. wire, bus, or terminal.

4.24 Advanced Dataflow
The Advanced
Dataflow window ![]() (View | Advanced
Dataflow) is a tool that allows designers to explore the connectivity of a
design and analyze dataflow among instances, statements, signals/nets, and
registers during simulation.
(View | Advanced
Dataflow) is a tool that allows designers to explore the connectivity of a
design and analyze dataflow among instances, statements, signals/nets, and
registers during simulation.
Уважаемый посетитель!
Чтобы распечатать файл, скачайте его (в формате Word).
Ссылка на скачивание - внизу страницы.