• ![]()
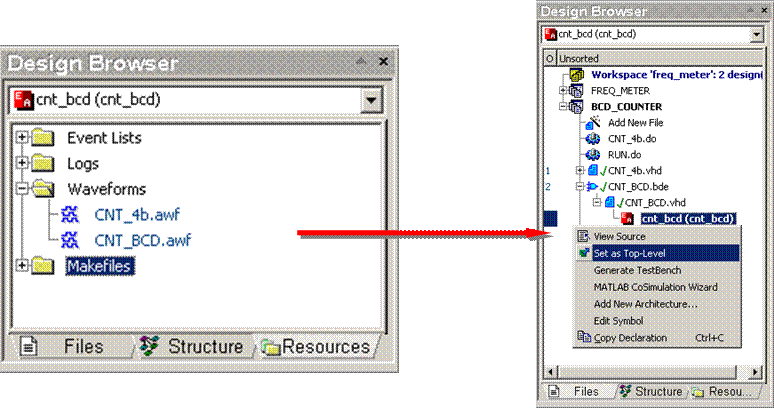
![]() Open the previously saved CNT_BCD.AWF waveform
file. Use the Resources tab of the Design Browser. Double click on the CNT_BCD.awf
item to open the waveform
Open the previously saved CNT_BCD.AWF waveform
file. Use the Resources tab of the Design Browser. Double click on the CNT_BCD.awf
item to open the waveform
• Make sure the top-level entity-architecture pair is set to cnt_bcd(cnt_bcd)
 |
![]()

4.3 Setting Code Breakpoints
• Open the CNT_4b.vhd file
• Place the breakpoint in the CNT_4b.vhd file (press the F9 key) on the following line:
Qint <= Qint + 1;
• Initialize simulation (Simulation | Initialize Simulation menu option).
• Open the Watch window (View | Watch menu option).
4.4 Setting up the Watch window
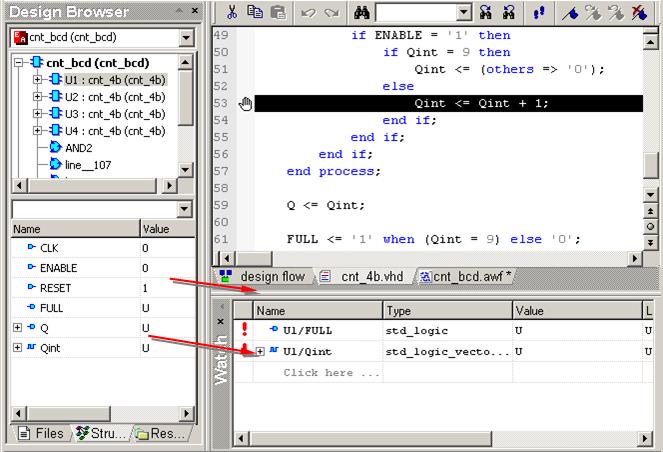
• Click the U1:cnt_4b(cnt_4b) item in
the Design Browser / Structure tab.
Note: if you see different instance labels, click the first
instance of CNT_4b
• Using ‘drag & drop’ feature, add the FULL and Qint signals to the Watch window
 |
4.5 Watch Display Radix
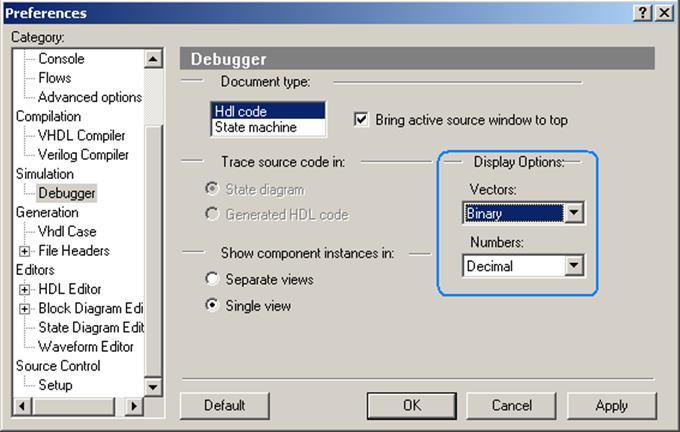
• To change the display radix in Watch window, select any signal and invoke the pop-up menu (right click on signal). Choose Display Options and choose (e.g. Binary for Vectors) in the Preferences window
4.7 Setting Signal Breakpoints
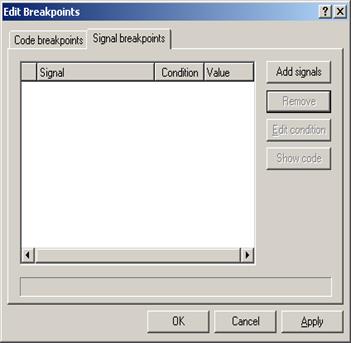
• In Simulation menu choose Edit Breakpoints option and switch to Signal Breakpoints tab
• Use Add signals button to invoke dialog which lets you pick the signals you want to use to stop simulation
• Select FULL output of U1 instance of cnt_4b and click on the Add button
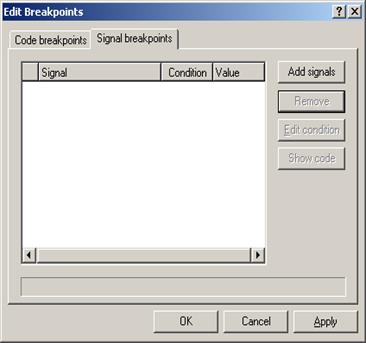
4.8 Setting Signal Breakpoints
• Use the Edit condition button to modify breakpoint’s properties
• Select Value radio and enter ‘1’ in the edit box next to it
• Hit OK to confirm your selections
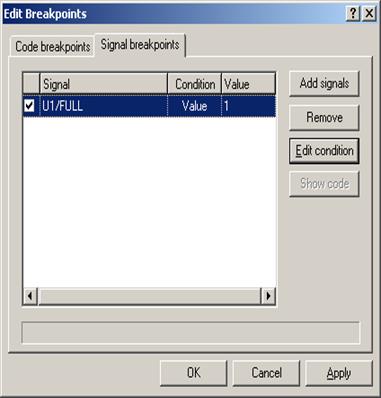
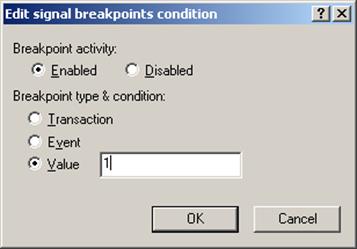
4.9 Running Debug Simulation
• Perform the Run operation (Simulation | Run menu option) several times & observe the signal values in the Watch window. Notice the messages in console window.
NOTE: It is possible to change the value of the variable during simulation by editing it in the Watch window (in this simulation there are no variables to change).
• Exclamation marks on left hand side of the signal name in Watch window mean that an event took place in current simulation cycle
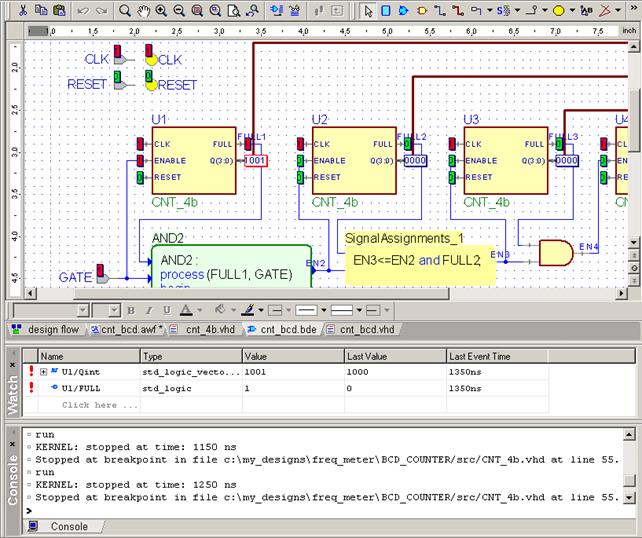
• Probes in Block Diagram Show actual values of the signals. The display radix can be customized in the Diagram | Probes Appearance
4.10 Trace
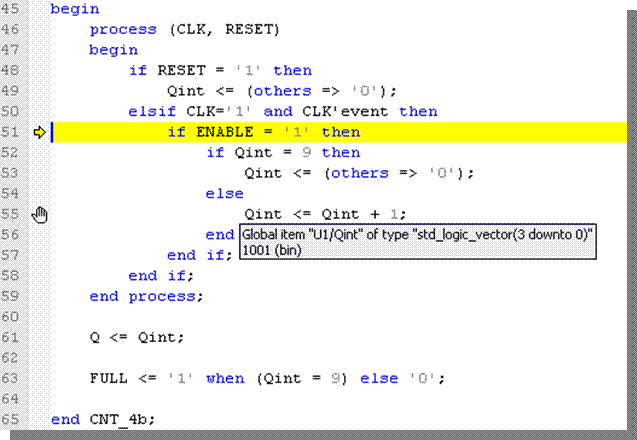
• When the simulation stops at Code
Breakpoint set in CNT_4b.vhd, press Trace button ![]() to
step through execution of your code
to
step through execution of your code
• Please note pop-up hints showing actual values and types of objects near the mouse cursor
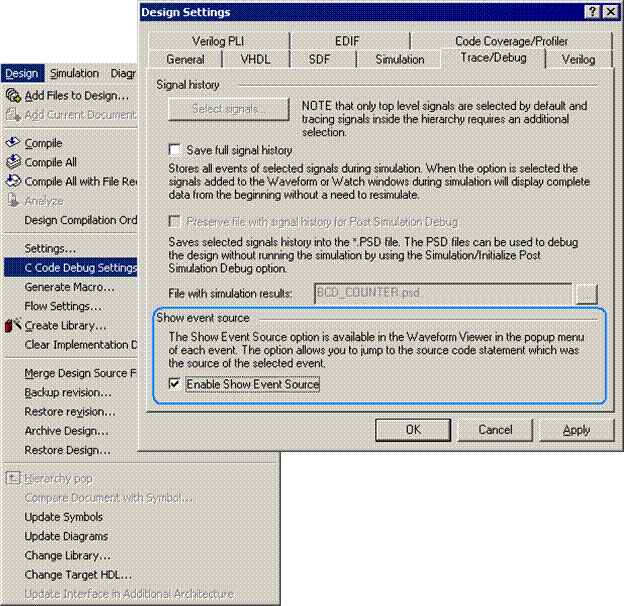
4.11 Enabling Show Event Source feature
• Finish the simulation (Simulation | End Simulation)
• Remove all Breakpoints (Simulation | Clear All Breakpoints)
• Finish the simulation (Simulation | End Simulation)
• Remove all Breakpoints (Simulation | Clear All Breakpoints)
 |
4.12 Using Show Event Source feature
• Switch to Waveform Editor window (CNT_BCD.AWF) and run simulation until 14450 ns
• Right click on the event on BCD_A signal at current simulation time and use Show Event Source Option
• Switch to Waveform Editor window (CNT_BCD.AWF) and run simulation until 14450 ns
• Right click on the event on BCD_A signal at current simulation time and use Show Event Source Option
4.13 Using Follow Object
• You should end up in line 61 of CNT_4b.vhd, where the Q output of counter is assigned Qint value
Уважаемый посетитель!
Чтобы распечатать файл, скачайте его (в формате Word).
Ссылка на скачивание - внизу страницы.