6.26 WAVES Testbench
The testbench wizard has created a folder Waves that is visible on the Files tab of the Design Browser window. This folder contains several files.
• Counter_TB_pins.vhd - package contains declaration of
enumerated type with the
UUT ports names
• Counter _TB_declaration.vhd - package contains declaration of all used in testbench constants and types
• Counter _TB_header - TEXT header file contains the main
information about
WAVES testbench files and
objects
• waves_objects.vhd - standard WAVES package
• waves_utilities.vhd - package contains procedures for
monitoring and
comparison the UUT outputs
• waves_generator.vhd - package contains procedure for
reading test vectors from
the file and generating stimulus
and output patterns
• Waveform_Editor 1.vec - file with test vectors
• Counter _TB.vhd - top level testbench entity
• Counter _TB_tim_cfg.vhd - top level testbench configuration for timing simulation
• Counter _TB_runtest.do - macro for running compilation files, initialization of simulation, waveform creation and simulation of the whole testbench
6.27 WAVES Testbench
• Files with icon are not generated by the WIZARD. These files are constants and are the same for each WAVES testbench.
The rest of the files are specific for the design. The two most important files are:
• *_declaration.vhd - user can change some objects’ declarations important for simulation
• *_runtest.do - the simulation macro can also be customized by user

6.28 WAVES Testbench
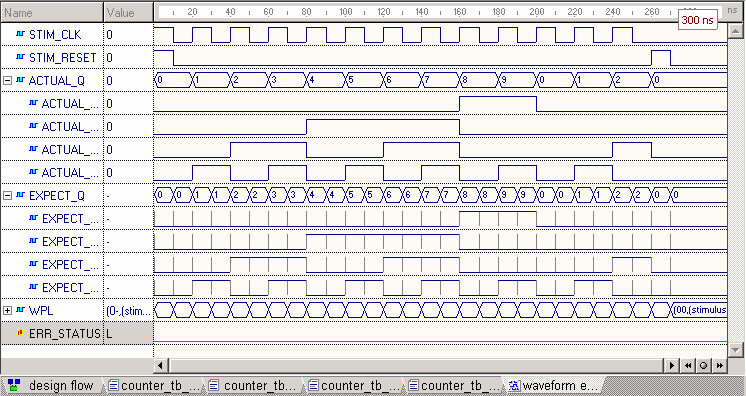
To simulate the design with a WAVES testbench, run the Counter _TB_runtest.do macro file. The simulation results are shown in the figure.

6.29 WAVES Testbench
• The WAVES testbench compares the output response with a previously saved pattern within the ‘comparison window’
• Default size of this window is only 1 ps narrower than the test vector step time.
• To display the simulation result you can use the Zoom to fit toolbar button.
Design Verification
Code and Toggle Coverage
Course 7
7. Code Coverage
Code Coverage is a tool integrated within Active-HDL.
It is a debugging tool that allows you to check how efficient your HDL source code is. It gives detailed information about the statements that are executed during design simulation. Code Coverage examines each executable statement and checks how many times it has been executed. It also provides detailed information about the conditional statement execution – so called Branch Coverage.
7.1 Enabling Code Coverage
To enable Code Coverage you have to:
• Open the Design Settings window from the Design menu
• Select the Code Coverage/Profiler tab
• Select Coverage radio buttonin the Enable section
• Specify the name of the output file directory
• Press OK button

![]()


7.2 Enabling Code Coverage
When a design simulation is initialized by a DO-macro file and you would like to use Code Coverage, you have to initialize simulation with following options:
asim -cc -cc_dest $DSN/coverage counter_tb
This will enable Code Coverage data gathering in default mode i.e. information will be collected for each unit. To distinguish each instance from the others, use syntax:
asim -cc –cc_hierarchy -cc_dest $DSN/coverage counter_tb
Note: Please refer to on-line documentation for more details on asim command usage.
7.3 Invoking Code Coverage Viewer
Уважаемый посетитель!
Чтобы распечатать файл, скачайте его (в формате Word).
Ссылка на скачивание - внизу страницы.