The hierarchical or flat dataflow diagram displayed by the Advanced Dataflow may be especially helpful while tracing events propagating through the entire project and identifying those that may be potential sources of unexpected output values.
The Advanced Dataflow Viewer displays design interconnects in one of two modes:
• Hierarchical
• Flat
4.25 Advanced Dataflow
In the Flat mode, statements, port maps, signals/nets from all units on all hierarchy levels are flattened and displayed as a single-level diagram. Each object displayed in the window has a reference pointing to its full path within the design hierarchy. Placing the cursor over the symbol, brings up the tooltip that displays detailed information on the object (name, hierarchy path, value, and type of a signal or port, etc.).
4.26 Advanced Dataflow
The Hierarchical mode displays instances along with information on the design hierarchies and library paths. Instances are displayed within frames that outline HDL statements and signals/nets forming design units that are connected to other symbols via port maps.
4.27 Advanced Dataflow
A primary purpose of Advanced Dataflow is to allow exploring the connectivity of a design and enable tracing events propagating through the entire project, which may help identify sources of unexpected outputs. It allows expanding the view from one process to another and watch drivers and readers of a particular signal or net. The connectivity of the design can be expanded by using the commands from the pop-up menu:
• Expand Net
• Expand Net to Readers
• Expand Net to Drivers
• Xway
4.28 Advanced Dataflow
• Expand Net
Displays drivers and readers of the selected signal, net, or register
• Expand Net to Readers
Displays readers of the selected signal, net, or register
• Expand Net to Drivers
Display drivers of the selected signal, net, or register
• Xway
Expands recursively the selected net through the design in order to find the source of X or U value.
4.29 Advanced Dataflow
Regardless of the selected working mode, the Advanced Dataflow window is always synchronized with Advanced Dataflow Trace.
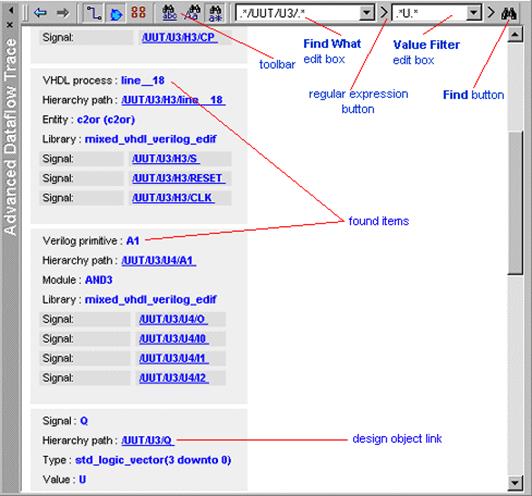
The Advanced Dataflow Trace option is designed for:
• Displaying detailed information on design objects (signals/nets, their types, values, and hierarchy, instances, statements, port maps, etc.) selected in the Advanced Dataflow window
• Finding signals/nets, instances, and HDL statements displayed within the current dataflow diagram
4.30 XTrace
The xtrace command creates a report with information on unknown values in the simulated model. By default, XTrace generates a report for the X, U, and - (Don't care) values. It is, however, possible to xtrace other values of the std_logic type.
XTrace monitors the specified signals and provides exact information on the time of unknown value occurrence, hierarchy path and if necessary drivers contributing to the affected signal. To enable the XTrace monitoring on all signals in the design issue following command after the simulation is initialized.
xtrace –drivers –rec *
The –drivers switch turns the driver information logging on. The X values will be reported in the Console window as they happen during the simulation.
A report will be written to the xtrace subfolder folder in the design’s directory for post processing once the the simulation is finished.
4.31 Xtrace and Advanced Dataflow
The xtrace can be used in conjunction with Advanced Dataflow to effectively find the causes of unknown values. To enable the XTrace to Advanced Dataflow crossprobing, initialize the simulation and issue following command in console window:
xtrace -advdataflow -hold -rec *
The –advdataflow switch turns on the crossprobing and –hold will stop the simulation right after the unknown value occurs. Run the simulation and once you observe in Console window XTrace message:
Уважаемый посетитель!
Чтобы распечатать файл, скачайте его (в формате Word).
Ссылка на скачивание - внизу страницы.