Indicator Criteria grid: Allows the user to specify up to 128 tests and corresponding images to be displayed in the selected field, depending on which criteria are met by the value in the field.
Test for '<field-name>': Contains operators used to define the criteria that must be met by the values in the Value(s)column for the indicator in the Imagecolumn to be displayed. The column header contains the name (or alias) of the selected field to make it clear exactly what the test is referring to. Clicking in a cell in this column enables a drop-down list with the following choices:
n equals
n does not equal
n is greater than
n is greater than or equal to
n is less than
n is less than or equal to
n is within
n is not within
n contains
n does not contain
n contains exactly
n is any value
Up to 128 different tests can be entered. If conflicting test conditions or data ranges are specified, the order in which the tests are listed in the grid determines which one takes precedence. The list is applied in top-to-bottom order, and processing is halted as soon as a test evaluates to true; if there are overlapping or conflicting tests conditions further down the list, they have no impact. The Move buttons can be used to arrange the tests in the order that suits the purposes of the user.
For example, if the first row says to show a yellow circle for values greater than 10 and the second row says to show a red circle for values less than 20, then a yellow circle will be displayed for all values over 10 and a red circle will only be displayed for values less than or equal to 10. Reversing the order of these two rows will cause a yellow circle to only show for values above 20 and red will be displayed for 20 or less.
Halting the process at the first successful test allows the user to enter specific tests at the top followed by more general tests below. For example, the first test could specify a blue flag for the value 75, the second test could specify a green flag for values between 50 and 100, and the third test could specify a red flag for every value greater than zero. The result would be equivalent to explicitly specifying 75=blue, 50 to 74=green, 76 to 100=green, 1 to 49=red, and >100=red.
“is any value” test: This test is exclusive to graphical indicators. The “is any value”test means that the test is true for whatever value may be in the field, so the chosen indicator will be displayed for every row. When “is any value” is selected, the label <All> is automatically inserted into the adjoining cell in the Value(s) column and that cell is disabled:
The normal use of “is any value” would be to specify an indicator that applies wherever no other comparison test is successful (that is, to serve as an "other" or "else" condition). Since it always evaluates to true, no tests following it will ever be evaluated, so it should always be put at the end of the list.
Similar to editing a filter, any test condition can be selected in the drop-down independent of the data type of the custom field for which the test is being specified, but once OKis pressed in the dialog, the following message is displayed if the test is not valid for the current data type:
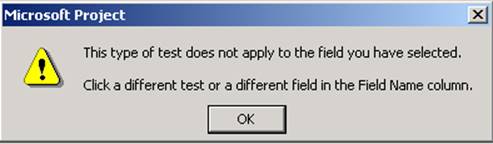
Figure 19 - Test is not apply
When the user clicks OK, they are returned to the Graphical Indicators dialog with the focus on the first cell in the Testcolumn containing a problem.
Value(s): This column is where the user enters the actual values or range of values to which the test criteria are to be applied. Clicking in the column enables a drop-down combo box. The user can type in an appropriate data value up to 255 characters in length, or can use the value in another task or resource field by selecting the field from the drop-down list. Each field is displayed in square brackets to indicate that these are field references that will be replaced by the actual field data.
Уважаемый посетитель!
Чтобы распечатать файл, скачайте его (в формате Word).
Ссылка на скачивание - внизу страницы.