A hyperbolais called a locus of
points, a modulus of difference of distances from which to the two given points
F1 and F2 (focuses) is a
constant value. 
An equation of hyperbola is:
Here the origin of coordinates is a center of symmetry of ellipse, and the coordinate axes are its axes of symmetry.
A parabola is called a locus of points, equidistant from the given point F (a focus) and the given straight line (a directrix)
The axis ОХ is here an axis of symmetry of parabola.
![]() An
equation of parabola is:
An
equation of parabola is:
The general form of the second-order curve:
The particular cases:
x2-y2=0, x2-4=0, x2-4x+4=0, x2+y2=0 (two straight lines or one point).
Topic: The function of one variable
1. The main definitions
2. The different ways of representing of the functions
3. The main characteristics of behavior of the function
4. The basic elementary functions
5. The composite function
6. The elementary functions
1. The most of scientific problems deal with quantities and relations between them and even in the experience of every day we often come across conditions illustrating the dependence of one quantity on another.
Let’s assume that given two sets, say X and Y.
Definition. A function is a rule which assigns to each element x of X one and only one element y of Y.
Notation: y=f(x)
x is called the independent variable, y is called the dependent variable. The set X from which the values of x can be chosen is called the domain of the function (D(y)). The set of all corresponding values of y is called the range of the function (E(y)).
Consider a number of examples.
1) f(x)=x3-4x+2 (polynomial of the third power)
This function is defined for every value x, that is without exception f(x) is a real number whenever x is a real number. Therefore, D(y)=(-∞; +∞).
2)  This function defined for all values of x
except x=2. When x=2 the divisor becomes zero and the value of y
cannot be computed. Hence, D(y)=(-∞; 2)
This function defined for all values of x
except x=2. When x=2 the divisor becomes zero and the value of y
cannot be computed. Hence, D(y)=(-∞; 2)![]() (2;
+∞).
(2;
+∞).
3) ![]() . D(y)=(-∞; +∞). (Because the degree of the root is an odd number).
. D(y)=(-∞; +∞). (Because the degree of the root is an odd number).
4)  . This function defined for all positive
values. D(y)=(2; +∞).
. This function defined for all positive
values. D(y)=(2; +∞).
 5)
5)
 .
.
6) .
2. There are the different ways of representing of the functions. The simplest one of them is the verbal description of dependence. But in math the most important ways are as follows:
- the analytic method;
- the tabular method;
- the graphical method.
Let’s dwell in detail on these issues.
The analytic method. We say that function y=f(x) is represented analytically if the variables x and y are connected with each other by equations.
Examples:
- an explicit function (y is expressed in terms of x);
 |
![]() - an implicit function (y is not expressed in terms of x);
- an implicit function (y is not expressed in terms of x);
- an implicit function;
 5) The demand function , where q - price, p – demand;
6) Cost function V(x), income function D(x), profit function P(x), where x – the volume of production.
The tabular method:
|
|
|
|
… |
|
|
|
|
|
… |
|
The tables have the special importance when they represent a function, the analytic expression for which is unknown.
The graphical method:
 |
Let’s take this opportunity to recollect the main ways of the transformations of the graphs.
1) Right-left translation
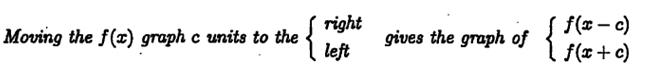
Example: y=(x-1)2

The graph is obtained by moving the graph x2 one unit to the right.
2) Up-down translation
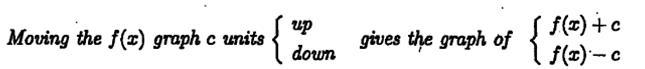
Examples: a)
Sketch the graph ![]()

b) Sketch the graph y=x2+4x+1.
3) Changing scale: stretching and shrinking

Example: Sketch
the graph ![]()
![]()

Example: Sketch
the graph ![]() ,
,
(We have to shrink the x-axis by the factor 2 and then stretch the y-axis by the factor 3)
3. The main characteristics ofbehavior of the function
1) The function is called the monotonic on the interval if it is or increasing on this interval either decreasing on this interval.
The function is said to be increasing if y increases when the independent variable x increases:
Уважаемый посетитель!
Чтобы распечатать файл, скачайте его (в формате Word).
Ссылка на скачивание - внизу страницы.