1) y=x4-4x3;
 |
|||
 |
|||
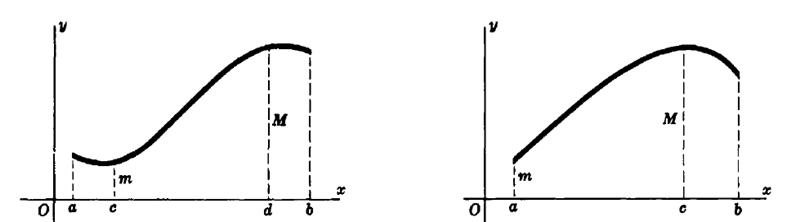
4. Before discussion this issue let’s recollect the following property of functions which continuous on some segment:
If the function f(x) is continuous on the segment [a; b] then it takes on its least value and its greatest value on this segment.
Algorithm of investigation of the function for the greatest and least values on the segment
1) Find the domain D(y) of the function; check that
2) Evaluate the derivative of the function.
3) find the critical points of the function;
![]() 4) select the critical points in the segment
4) select the critical points in the segment
5) calculate the values of f(x) at the chosen [ou] critical points and at the endpoints of segment;
6) compare the obtained values, make the conclusion.
Example. y=x3-3x+5, [0;2].
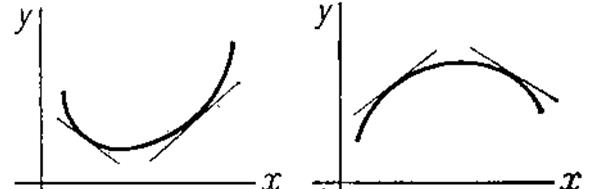
5. Definition. The function is said to be concave on the interval (a; b) if all points of the graph of this function are located above tangent lines to this graph on this interval.
The function is said to be convex on the interval (a; b) if all points of the graph of this function are located below tangent lines to this graph on this interval.
Theorem (sufficient conditions of convexity and concavity of function).
Definition. The point of the curve is called the point of inflection if this point separates the convex part of the curve from its concave part.
Theorem (sufficient conditions of the point of inflection)
If and changes its sign at the point x0, then x0 is the abscissa of the point of inflection.
Thus (x0;f(x0)) is the point of inflection.
Example. Investigate the given function for convexity, concavity and inflection points.
 |
 |
|||||
 |
||||||
 |
||||||
6.

Definition. An asymptote of a curve is a line such that the distance between the curve and the line approaches zero as they tend to infinity.
There are two types of asymptotes:
1) vertical (they correspond to the discontinuity point of the second type);
2) oblique (in particular, horizontal).
The equation of the oblique asymptote has the form:
where the coefficients can be calculated by the formulas:
 |
|||
Examples.
 |
 .
.
7. The algorithm of investigation of function and construction of its graph.
І. Global research
1) D(y).
2) Even, odd, periodicity.
3) The points of intersection of the axes; the intervals of constant sign of the function.
4) Vertical asymptotes.
5) Oblique asymptotes.
6) Sketch of the graph.
ІІ. Local investigation
1) Investigation of the function for monotony and extrema.
2) Investigation of the function for convexity, concavity and inflection points.
3) Graph of the function.
Example. 
Topic:Application of differential calculus of function of several variables
1. Definition of extremum of function of two variables. Necessary and sufficient conditions of extremum of function of two variables.
2. Conditional extremum of function.
3. The problem of a global maximum and a global minimum of function on a closed bounded region D of R2.
4. Least squares method.
The theory of maxima and minima for function of two variables is similar to the theory for one variable, but there are some differences.
1. Let z = f(x, y) be a function with domain D.
Definition. Function f is said to have a maximum at the point (x0, y0) in domain D if (the inequality below holds)
![]()
for all points (x, y) in D sufficiently close to the point (x0, y0).
This point is called the point of maximum, the function value at this point is called maximum value.
Graphical interpretation of the point of maximum:
 |
(This is a graph of the function of two variables. The highest point of this surface corresponds to the point of maximum, denoted as M0. In this case z0=f(x0,y0) is a maximum value of the given function.)
Уважаемый посетитель!
Чтобы распечатать файл, скачайте его (в формате Word).
Ссылка на скачивание - внизу страницы.