Fig. 6. Relative effectiveness of various antiscalants at a water recovery of 72% and antiscale dosage of 12 ppm.
The effects of the supersaturation level and of the presence of an antiscalant can be conveniently observed by plotting normalized real permeabilities vs. time (Figs. 3–6). The scaling potentials Sb/Sw (Table 4) are given in legends of these figures.
Fig. 3 shows the effect of the CaSO4 supersaturation level on the severity of flux decline in experiments carried out without dosage of an antiscalant. The concentration polarization level in these runs was significant, in the range of 1.1–1.3 and the supersaturation ratio on the membrane surface was in the range of 2.8–4.3. As expected, induction times in all cases were very short, and the rate of scaling, as reflected by the rate of permeability decline, increased systematically with the increase in the supersaturation level.
Fig. 4 illustrates the permeability decline data measured with antiscalant B at 6 ppm feed dosage. Comparison with Fig. 3 shows the expected trends — antiscale dosage acts to extend the induction period and to reduce the permeability decline.
Table 5
|
Antiscalants |
Slope |
Ln (B/A) |
Surface energy Feff1, mJ/m2 |
Surface energy Feff2, mJ/m2 |
|
Blank |
2.66 |
5.76 |
14.7 |
9.3 |
|
A, 6 ppm |
1.52 |
7.67 |
12.2 |
7.7 |
|
A, 12 ppm |
8.27 |
6.00 |
21.4 |
13.5 |
|
B, 6 ppm |
4.24 |
6.27 |
17.1 |
10.8 |
|
B, 12 ppm |
9.47 |
5.47 |
22.4 |
14.1 |
|
D, 12 ppm |
10.68 |
5.76 |
23.3 |
14.7 |
|
C, 6 ppm |
11.46 |
5.44 |
23.9 |
15.1 |
|
C, 12 ppm |
13.13 |
4.40 |
25.0 |
15.8 |
|
D, 6 ppm |
15.71 |
4.02 |
26.5 |
16.7 |
|
SHMP, 6 ppm |
16.93 |
3.05 |
27.2 |
17.1 |
|
SHMP, 12 ppm |
19.54 |
2.73 |
28.5 |
18.0 |
Surface energy results
The relative effectiveness of the various antiscalants in suppressing the onset of CaSO4 scaling was analyzed by comparing permeability decline data measured under closely similar supersaturation conditions and at the same antiscalants concentration. Figs. 5 and 6 present permeability decline results obtained with a substantially constant wall supersaturation ratio of 3.9–4.4 at two different antiscalant feed dosages: 6 ppm (Fig. 5) and 12 ppm (Fig. 6). The general trends seen in Figs. 3–6 as regards the effectiveness of scale suppression under various conditions, may be summarized as follows:
C As anticipated, induction time tends to decrease as the supersaturation level is increased.
C A clear difference in scale suppression effectiveness can be noted between the five antiscalants tested. SHMP provided the highest induction periods. Antiscalants C and D displayed a somewhat lower inhibitory effectiveness. The least effective antiscalants were those denoted as A and B.
C Doubling the antiscalants dosage had a slight effect on the extent of induction time period for the more effective antiscalants (SHMP, C,
Fig. 7. Linear correlation of induction time for antiscalant A runs.
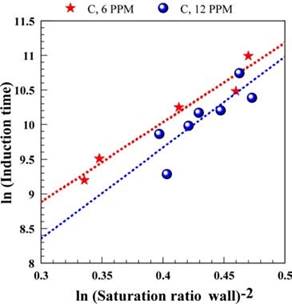
Fig. 9. Linear correlation of induction time for antiscalant C runs.
Fig. 8. Linear correlation of induction time for antiscalant B runs.
Fig. 10. Linear correlation of induction time for antiscalant D runs.
D). However, in the case of the less effective antiscalants (A and B), doubling the anti-scalant dosage significantly improved the antiscalant performance — induction times approached those of the more effective antiscalants.
Уважаемый посетитель!
Чтобы распечатать файл, скачайте его (в формате Word).
Ссылка на скачивание - внизу страницы.