|
Antiscalant |
Composition |
|
Calgon, SHMP |
Sodium hexametaphosphate |
|
A |
Organophosphonate |
|
B |
Sodium salts of phosphonic acids |
|
C |
Polyacrylate |
|
D |
Unspecified copolymer |
(antiscalant concentrations are given in terms of the antiscalant solution, not in terms of active material). Antiscalant dosage was adjusted according to the water recovery level. For instance, in a run performed with an initial solution corresponding to 50% water recovery, the initial antiscalant dosage for the 12 mg/L series of experiments was 24 mg/L.
Induction time measurements are not easily reproducible. In order to verify the accuracy of induction time measurements, each experiment was repeated twice. In general, reproducibility was satisfactory; repeat measurements gave usually induction times in agreement within 1 h.
Information on the onset of scale deposition was obtained from periodic measurements of permeate flow rate, frictional pressure drop along the membrane, feed turbidity and the Ca+2 and SO4!2 concentration changes in the recycling solution. In general, the four different criteria gave similar indications on the onset of scaling. It was found, however, that the frictional pressure increase due to scaling endangered the membrane and the experiment was usually terminated as soon as a pressure rise was detected. Apparently, the sharp needle-like CaSO4 crystals can scratch the membrane surface and deteriorate its salt rejection capability.
The crystal habit of CaSO4 solidifying at room temperatures is the dihydrate form (CaSO4@ 2H2O). Chemical and electromicroscope analyses of samples confirmed that the scale formed on the membrane was CaSO4@2H2O.
Fig. 2 shows typical measurements of the change with time of the three parameters used to indicate the onset of scaling (supersaturation ratio
Sw on the membrane wall, real membrane permeability and feed turbidity). The decline in membrane permeability and supersaturation ratio was very slow in the first period of the experiment. The slow change period was taken to represent the induction time since it was followed by a period in which both the permeability and the supersaturation ratio declined relatively rapidly, at a substantially linear rate. Fig. 2 shows that the onset of bulk precipitation, as indicated by turbidity measurements, coincides with the onset of scaling on the membrane, as determined by permeability data. In the final period of the
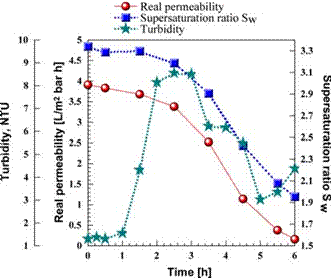 experiment, in which the
supersaturation ratio was reduced by the precipitation process, the decline in
permeability and in the supersaturation ratio was again slow, as could be
anticipated.
experiment, in which the
supersaturation ratio was reduced by the precipitation process, the decline in
permeability and in the supersaturation ratio was again slow, as could be
anticipated.
Table 4 summarizes induction time measurements carried out with the five tested anti-scalants at three solution concentrations corres-ponding to water recoveries of 72, 75 and 78%, respectively. The level of the scaling potential in each run is given in the column Sb/Sw where Sb is the
Fig. 2. Results of a typical full recycle experiment magnitude of the supersaturation level in the bulk
(Run 52). and Sw is its magnitude on the membrane
Table 4
Summary of induction time experiments
Уважаемый посетитель!
Чтобы распечатать файл, скачайте его (в формате Word).
Ссылка на скачивание - внизу страницы.