|
Antiscalant |
Recovery 72% |
Recovery 75% |
Recovery 78% |
||||||
|
Exp. no. |
Ind. time, h |
Sb/Sw, % |
Exp. no. |
Ind. time, h |
Sb/Sw, % |
Exp. no. |
Ind. time, h Sb/Sw, % |
||
|
Blank |
41 40 36 42 |
0.625 0.875 0.75 0.25 |
2.9/3.7 3.1/3.9 3.1/4.0 3.2/4.0 |
44 |
0.25 |
3.4/4.3 |
|||
|
A, 6 ppm |
32 48 |
1.5 0.7 |
2.9/3.8 3.1/3.9 |
43 |
1 |
3.4/4.0 |
46 |
1.5 |
3.8/5.2 |
|
A, 12 ppm |
68 158 155 |
6.75 4.38 8.75 |
3.0/4.1 3.0/4.5 3.1/4.1 |
59 157 |
3.5 3.25 |
3.6/4.4 3.6/4.8 |
60 63 156 |
5 5.25 2.13 |
4.1/4.6 4.0/4.6 4.1/5.1 |
|
B, 6 ppm |
51 |
2 |
2.9/4.0 |
47 |
1.125 |
3.6/4.4 |
45 |
0.75 |
3.8/4.9 |
|
B, 12 ppm |
152 153 |
10.5 11 |
3.2/3.9 3.2/3.9 |
105 154 |
9 |
3.3/4.1 |
64 149 95 |
4.25 3 2.5 |
4.0/4.7 3.8/5.0 3.6/4.7 |
|
SHMP, 6 ppm |
115 116 |
21.5 18.5 |
3.3/4.4 3.1/4.2 |
58a 56 |
12 >10 |
3.5/4.3 3.4/4.4 |
57a 97 |
6.5 >9.5 |
3.9/4.7 4.2/4.7 |
|
SHMP, 12 ppm |
99a 131 132 |
>9.5 34±5 43 |
3.2/4.1 3.2/4.4 3.1/4.3 |
87a a 100 133 |
>9.5 >9.5 23 |
3.6/4.6 3.7/4.5 3.5/4.5 |
74 a 104 |
8.25 >9.5 |
4.1/5.0 4.3/4.8 |
|
C, 6 ppm |
78a 117 160 |
>10 16.5 9.9 |
3.1/4.2 3.1/4.3 3.1/4.4 |
79 147 162 |
5.5 8 4.75 |
3.9/4.6 3.9/4.7 3.6/4.6 |
119 161 |
2.75 3.74 |
4.1/5.6 4.3/5.5 |
|
C, 12 ppm |
120 159 166 |
7.5 12.5 9 |
3.2/4.5 3.2/4.4 3.2/4.3 |
122 165 167 |
7.25 5.33 6 |
3.6/4.6 3.6/4.9 3.6/4.9 |
75 |
3 |
4.3/5.5 4.0/4.8 |
|
D, 6 ppm |
124a 140 170 |
>12 29 15.5 |
3.2/4.4 2.7/4.3 3.3/4.4 |
84aa 88 171 |
>6 >9.5 8.5 |
3.4/4.2 3.6/4.1 3.6/4.9 |
98 168 |
8.5 2.5 |
4.0/5.0 4.2/5.6 |
|
D, 12 ppm |
173 176 |
11.5 12 |
3.2/4.4 3.1/4.4 |
103a 178 |
>9 5 |
3.5/4.6 3.5/5.2 |
111 123 |
6 3.25 |
3.7/4.8 4.2/5.5 |
aRun terminated before the onset of membrane scaling.
surface. Membrane wall super-saturation ratios were in the range of 3.7–4.4 (for 72% recovery), 4.1–4.9 (for 75% recovery) and 4.6– 5.5 (for 78% recovery).
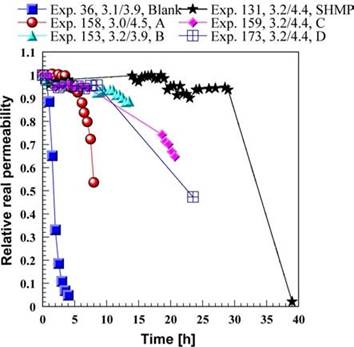
In several runs marked with a star (*), the
Fig. 3. The effect of the CaSO4 supersaturation ratio on the severity of flux decline (blank, no antiscalant).
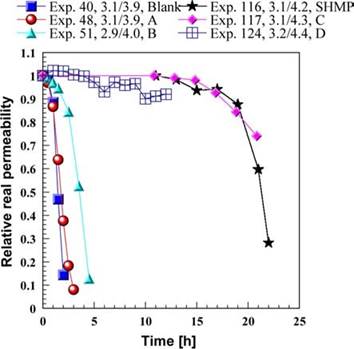
Fig. 5. Relative effectiveness of various antiscalants at a water recovery of 72% and antiscale dosage of 6 ppm.
onset of scaling was not detected during the time of the experiment; in these runs the magnitude of the induction period has a higher value than the experimental time. Inspection of results of repeat runs shows that reproducibility of induction time measurements was satisfactory in most cases.
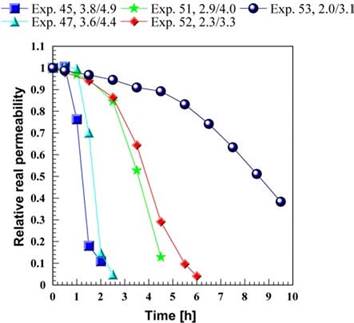
Fig. 4. The effect of the CaSO4 supersaturation ratio on the severity of flux decline (antiscalant B, 6 ppm).
Уважаемый посетитель!
Чтобы распечатать файл, скачайте его (в формате Word).
Ссылка на скачивание - внизу страницы.