Induction periods in CaSO4 crystallization have been studied by many authors using a variety of experimental techniques. The present project provides the first published induction time results measured in a membrane system. A comprehensive compilation of literature data was undertaken in order to enable comparison of results measured in RO systems with those of other experimental systems.
Table 1 summarizes published results, indicating the nature of experimental procedure adopted in the various studies, the range of supersaturation ratios investigated and the values of the parameters characterizing the variation of induction time with the supersaturation level (B/A and F). Only one study [13] provides induction time results obtained in the presence of antiscalants.
Surface energies are listed in Table 1 according to the two alternative definitions of F given by Eq. (5). An unbracketed value is the surface energy as reported in the original paper while a bracketed value is the corresponding surface energy calculated from Eq. (5).
A comparison of literature induction time data with results measured in this study is presented in Section 5.2.
Fig. 1 is a schematic diagram of the experimental system. It is equipped with a laboratory spiral-wound module (type TFC-ULP 2514, Fluid Systems), consisting of two leaves, each 739 mm long and 267 mm wide, which provide a total permeate flow area of 0.58 m2. According to the catalogue specifications, the module is defined as a high flow moderate chloride rejection (98.5%) membrane element, operating at ultra-low pressures within the range of 3.5–10 bar with a permissible maximum operating pressure of 24 bar. Membrane flux for 2000 mg/l NaCl test solution is given as 40 L/m2 h at 7 bar.
The flow system enabled either partial recycling (concentrate recycled but permeate withdrawn from the system) or full recycling (both concentrate and permeate recycled to the feed vessel). In all experiments, flow through the membrane was at the rate of 450–500 L/h and transmembrane pressure was maintained at about 15 bar. Permeate flow rates were in the range of 15–30 L/h. Pump heat energy was removed from the recycling concentrate by using a water-cooled heat exchanger. Concentrate temperature was typically 28°C±3°C.
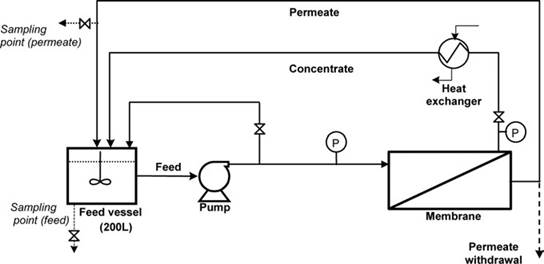
Fig. 1. Experimental system.
Table 1
Surface energy results reported in the literature
 Reference Exp. Location of Sat. Method
of Antiscalant T, pH Feff1, Feff 2, Slope conditions nucleation level measurement °C mJ/m2 mJ/m2
Reference Exp. Location of Sat. Method
of Antiscalant T, pH Feff1, Feff 2, Slope conditions nucleation level measurement °C mJ/m2 mJ/m2
process
|
Hina et al. [10] |
Magnetically stirred jacketed vessels |
Brushite (CaHPO4 2H2O) surface |
1.8–2.5 |
Calcium conc. None |
25 |
4.8 5.5 |
(14.4) (13.3) |
9.1 8.4 |
2.77 2.03 |
0.24 1.83 |
|
|
decline by selective electrode |
|||||||||||
|
Linnikov [11] |
Rectangular SS channel; bottom heated by electric heater; laminar flow |
Heated metal surface |
1.3–1.9 |
Microscope counts |
None |
69– 75 |
(7.9) |
5.0 |
|||
|
Klepetsanis et al. [12] |
Magnetically stirred (400 rpm) glass reactor |
Solution bulk |
1.3–1.7 |
Solution conductivity decline |
None |
25 38 50 65 80 |
18.0 19.0 17.0 17.0 13.0 |
(11.4) (12.0) (10.7) (10.7) (8.2) |
1.47 2.01 1.27 0.54 0.39 |
6.69 3.78 4.19 5.12 4.78 |
|
|
Vasina et al. [13] |
Film evaporator |
Heated metal surface |
1.1–1.4 |
Not specified |
None |
50 70 90 |
(11.7) (10.9) (10.5) |
7.4 6.9 6.6 |
|||
Уважаемый посетитель!
Чтобы распечатать файл, скачайте его (в формате Word).
Ссылка на скачивание - внизу страницы.