The decline in the profitability of technical trading based on daily data could be explained in two different ways. The “Adaptive Market Hypothesis” (Lo, 2004) holds that asset markets have become gradually more efficient, partly because learning to exploit profit opportunities wipes them out, partly because information technologies steadily improve market efficiency (Olson, 2004). The second explanation holds that technical traders have been increasingly using intraday data instead of daily data. This development could have caused intraday price movements to become more persistent and, hence, exploitable by technical models. At the same time price changes on the basis of daily data might have become more erratic. This would then cause technical trading to become less profitable based on daily prices (but not on intraday prices).[11] The next (and main) part of this paper shall shed

Fig. 2. Distribution of 2580 trading systems by the gross rate of return 1983–2007. S&P 500 futures market, 30-minutes-data.
some light on this issue by investigating the performance of technical stock trading based on intraday data.
4. The performance of technical trading systems based on 30minutes-futures-prices 1983–2007
In this section I document the performance of the same 2580 models in theS&P500 futures market based on 30-minutes-data insteadof daily data. Hence, the data base consists of the prices of the nearby contract which are realized first after the beginning of any 30-minutes interval during trading time (e.g., the price at 9:00:10; 9:30:05; 10:00:15; 10:30:03; etc.).[12] After an overview of the performance of all models in terms of gross and net returns, I shall discuss the performance of the 2580 models by type of model and trading rule as well as the pattern of their profitability. Then I classify the models into three groups with comparatively similar trading pattern; the first “specializes” on shortterm trends of 30-minutes-prices, the second on medium-term trends and the third on long-term trends. Finally, I document the performance of the models by subperiods and the profitability of the best models in sample and out of sample.
Figs. 2 and 3 show the distribution of the 2580 models by their gross and net rate of return. When trading S&P 500 futures contracts the models produce an average gross return of 7.2% per year between 1983 and 2007. Due to the high number of transactions when trading is based on 30-minutes-data the net rate of return is significantly lower (2.6%).
Fig. 2 shows that there exist abnormally many highly profitable models among the sample of 2580 models (the distribution is skewed to the right). At the same time the most profitable models trade much more frequently than on average over all models (Table 4). Hence, the distribution of models by the net rate of return (i.e., net of transaction costs—Fig. 3) is more symmetric as compared to the distribution by gross returns (Fig. 2).
|
can be
attributed to increasingly erratic fluctuations of daily stock prices.
Second, the average duration of profitable positions of the best
performing models (t-statistic>2) |
The t-statistic of the mean of the single rates of return exceeds 2.0 in most cases (Fig. 4), it amounts on average over all models to 2.37 (Table 3). This result indicates that there was rather little risk associated with technical stock trading based on 30-minutes-data if traders had rigidly adhered to a particular model out of the sample of
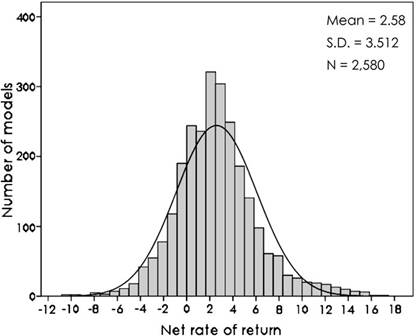
Fig. 3. Distribution of 2580 trading systems by the net rate of return 1983–2007. S&P 500 futures market, 30-minutes-data.
Уважаемый посетитель!
Чтобы распечатать файл, скачайте его (в формате Word).
Ссылка на скачивание - внизу страницы.