ex-post profits of the best models would have been produced only by chance (this bias increases as more models are tested and as the test period is shortened). Now, if the profitability of an “optimal” model is mainly the result of this “model mining” then the model will perform much worse over the subsequent period. However, if the ex-postprofitability stems mainly from the exploitation of “normal” price trends then it might be reproduced ex ante.
In order to investigate this matter, the following exercise is carried out. In a first step the 25 best models are identified on the basis of their ex-post performance as measured by the net rate of return. Then the performance of the selected models is simulated over the subsequent subperiod. The main results are as follows (Table 7):
• The ex-post-performance of the 25 best models is much better than the average performance of all models, e.g., the best models produce an average gross rate of return over the eight subperiods between 1983 and 2007 of 28.8% (all models: 7.2%).
• The ex-ante-profitability of the best models is significantly better than the average over all models. The best models achieve ex ante an
average gross rate of return of 14.5% between 1986 and 2007, over the sameperiod thegrossrate ofreturnof all models amounts to only 7.5%.
5. Summary and concluding remarks
The main results of the study can be summarized as follows:
• The profitability of technical trading in the S&P 500 spot market has declined over time from 8.6% per year (1960/71) to 2.0% (1972/82), −0.0% (1983/91), −5.1% (1992/2000) and finally to −0.8% (2001/ 07). The 2580 models are even more unprofitable when trading S&P 500 futures contracts between 1983 and 2007.
• The picture is very different for stock futures trading based on 30minutes-data. The 2580 models produce an average gross return of 7.2% per year between 1983 and 2007. Due to the high number of transactions the net rate of return is significantly lower (2.6%). Contrarian models achieve a significantly higher gross rate of return (9.1%) than trend-following models (4.8%).
• Only 2.6% of the 2580 models would have produced negative returns over the entire sample period. The probability of making an overall
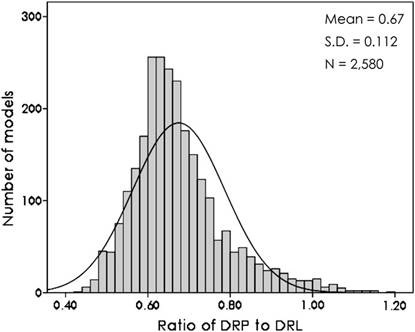
Fig. 6. Distribution of 2580 trading systems by the ratio of the daily return during profitable positions (DRP) to the daily return during unprofitable positions (DRL) 1983– 2000. S&P 500 futures market, 30-minutes-data.
Fig. 7. Distribution of 2580 trading systems by the ratio of the duration of profitable positions (DPP) to the duration of unprofitable positions (DPL) 1983–2000. S&P 500 futures market, 30-minutes-data.
loss when strictly following most of these models was close to zero (the t-statistic testing the mean of the single returns against zero exceeds 2.0 in 58.9% of all models).
• The profitability of technical stock futures trading is exclusively due to the exploitation of persistent price trends around which stock prices fluctuate. This can be concluded from the profitability pattern of technical models: The number of profitable trades is lower than the numberof unprofitable trades, andthe returnper day during profitable positions is smaller (in absolute terms) than during unprofitable positions. Hence, the overall profitability is due to profitable positions lasting several times longer than unprofitable positions.
• Tests of the performance of the trading systems over 8 subperiods between 1983 and 2007 reveal that the models would have produced profits in 4,707 out of 20,640 cases (8 subperiods times 2580 models).
• Those 25 models which performed best over the most recent subperiod produce an average gross return of 14.5% per year over the subsequent subperiod. This ex-ante-return of the best models is significantly higher than the average ex-post-return of all models (7.5%).
Уважаемый посетитель!
Чтобы распечатать файл, скачайте его (в формате Word).
Ссылка на скачивание - внизу страницы.