produce an average gross rate of return of 14.4%. The models of cluster 2 achieve a gross rate of return (10.0%) which is also higher than the average over all 2580 models. By contrast, the comparatively slow models of cluster 3 produce an average gross rate of return of only 5.4%.
The results of the cluster analysis are confirmed by Fig. 8. It shows the relationship between the performance of the models and their “specialization” on the exploitation of stock price trends of various lengths: The shorter is the average duration of the profitable positions of the models the higher is their profitability on average. For this reason the differences in the performance of the models is less pronounced on the basis of the net rate of return as compared to the gross rate (compare Figs. 2 and 3).
Table 4 shows how the 2580 technical models perform in the S&P 500 futures market over 8 subperiods between 1983 and 2007. The most important observations are as follows. First, in contrast to trading based on daily data there is no clear trend of a declining profitability when technical stock trading is based on 30-minutes-data. Second, the performance of the 2580 models varies significantly across subperiods. The models produce the highest returns over the subperiods 1989/91, 1986/88 and 1998/2000, whereas they perform comparatively worse over the subperiods 1992/94 and 2003/07.
Table 6 compares the performance of those models which are
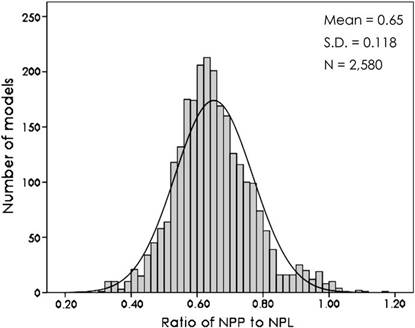
Fig. 5. Distribution of 2580 trading systems by the ratio of the number of profitable positions (NPP) to the number of unprofitable positions (NPL) 1983–2000. S&P 500 futures market, 30-minutes-data.
profitable in each of the 8 subperiods (“stable models”) to the performance of the other (“unstable”) models. Stable models are slightly less profitable than unstable models, the former produce a gross (net) rate of return of 6.3% (2.2%) on average; the latter achieve 7.4% (2.7%). This difference is mainly due to the following “structural effect”: Those types of models or signal generation which produce the highest returns liketheRSINmodels orSG4 (Table3) arecomparativelyunstable (Table 6). In an analogous way, less profitable models, like the SG1models (Table 3), are comparatively stable (Table 6).
Almost all of the 2580 trading models would have produced excessive returns over the entire sample period, 20.9% of these models would have been profitable over each of 8 subperiods, and the profitability of the models is exclusively due to the exploitation of stock price trends of varying lengths. Hence, it is implausible that the ex-post performance of stock futures trading based on 30-minute-data is the result of data snooping. However, the “trending” of stock prices does not ensure the profitabilityof technicaltradingexante.This is soforthefollowingreason.
The ex-post profitability of the best models consists of two components. The first component stems from the “normal” nonrandomness of stock price dynamics, namely, the occurrence of trends. The second component stems from the selection bias since a part of the
|
Table 4 Components of the profitability of 2580 trading systems by subperiods and classes of the t-statistic.
|
||||||||||||||||||||||||||||||||||||||||||||||||||||||||||||||||||||||||||||||||||||||||||||||||||||||||||||||||||||||||||||||||||||||||||||||||||||||||||||||||||||||||||||||||||||||||||||
Уважаемый посетитель!
Чтобы распечатать файл, скачайте его (в формате Word).
Ссылка на скачивание - внизу страницы.