Finally, I would like to sketch how technical trading could be viewed as rational behavior (this is, in many respects, the world as perceived by the“imperfectknowledge economics”approachof Frydman&Goldberg, 2007; an early sketch can be found in Schulmeister, 1987):
• There are three types of traders in the market. Fundamentalists, who basetheirexpectations primarilyon economic news, technical traders, who rely on the most recent price movements, and bandwagonists, who respond to “market moods” and the related price trends.
• The beliefs of traders concerning the functioning of the economy are heterogeneous. Hence, traders use different models and process information in different ways. This holds true also within each group of traders.
• Price movements are the aggregate outcomes of the transactions of all traders.
• As
a consequence, traders have to form expectations about expec![]() tations of all other traders (Keynes' “beauty
contest” problem).
tations of all other traders (Keynes' “beauty
contest” problem).
trading systems has most probably
contributed to the tremendous increase in ![]() transaction volume in financial markets. According to the Bank
of International Settlements (BIS) stock index futures trading volume in North
America rose between 2001 and 2007 from 11,911.1 bill. $ to 53,048.3 bill. $ (www.bis.org/statistics/qcsv/
anx23a.csv). A great deal of these transactions
might be triggered by (automated) trading systems which are increasingly based
on intraday data (the number of surprising announcements has most probably not
kept up with transactions).
transaction volume in financial markets. According to the Bank
of International Settlements (BIS) stock index futures trading volume in North
America rose between 2001 and 2007 from 11,911.1 bill. $ to 53,048.3 bill. $ (www.bis.org/statistics/qcsv/
anx23a.csv). A great deal of these transactions
might be triggered by (automated) trading systems which are increasingly based
on intraday data (the number of surprising announcements has most probably not
kept up with transactions).
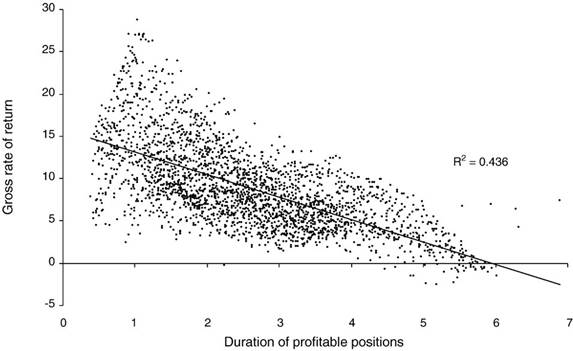
Fig. 8. Duration of profitable positions and the performance of 2580 trading systems. S & P 500 futures market, 30-minutes-data, 1983–2007.
• This problem cannot be solved quantitatively due to the lack of perfect knowledge. To put it concretely: One cannot quantify to which level a price will move in reaction to a certain piece of news (even if “technicians” and bandwagonists would not exist).
• Consequently, actors form their expectation on which they finally base their trading decision in terms of the direction of the imminent price movement.
Technical analysis fits thistypeof expectationsformationparticularly well since it also involves only directional expectations. However, technical trading does not even imply that the single trading signals correctly forecast the direction of subsequent price movements in most cases (trading signals are more often wrong than they are right as traders know). Moreover, if a trend develops, no technical model forecasts how long it will last and to which price level it might lead. Hence, the only “forecast” implied by the use of technical models concerns the pattern in asset price movements as a whole, i.e., the sequence of upward and downward trends interrupted by “whipsaws”.
On the one hand, technical trading systems exploit price trends in asset markets, on the other, the use of these trading systems strengthen and lengthen these trends (Schulmeister, 2006, 2007). This interaction might have contributed to a gradual change in the system of asset price determination:
• The profitability of technical trading causes more and more market participants to base their activity on this strategy. The related increase in the volume of transactions is fostered by the diffusion of new information and communication technologies.
|
Table 7 Performance of the 25 most profitable trading systems by subperiods and types of models. |
|||||
|
Gross rate of return t-statistics Net rate of return Duration of profitable positions
Ex post |
Gross rate of return |
t-statistics |
Net rate of return |
Duration of profitable positions |
|
|
Ex ante |
|||||
|
1983–1985 |
35.2 4.51 28.62 1.4 |
||||
|
1986–1988 |
41.6 2.80 35.16 1.7 |
28.8 |
1.72 |
21.31 |
1.4 |
|
1989–1991 |
35.7 4.14 27.71 1.4 |
27.1 |
3.15 |
20.68 |
1.7 |
|
1992–1994 |
18.3 3.31 14.02 2.4 |
15.1 |
2.79 |
8.53 |
1.5 |
|
1995–1997 |
25.6 3.33 17.27 1.6 |
7.8 |
1.00 |
1.75 |
1.7 |
|
1998–2000 |
26.0 2.39 21.82 3.3 |
14.6 |
1.30 |
5.86 |
1.6 |
|
2001–2003 |
35.7 3.01 25.45 1.0 |
3.5 |
0.31 |
−0.97 |
3.1 |
|
2004–2007 |
12.2 2.28 9.58 3.5 |
4.8 |
0.89 |
−3.81 |
1.4 |
|
1986–2007a |
27.8 3.04 21.57 2.1 |
14.5 |
1.59 |
7.62 |
1.8 |
|
|
|||||
Уважаемый посетитель!
Чтобы распечатать файл, скачайте его (в формате Word).
Ссылка на скачивание - внизу страницы.