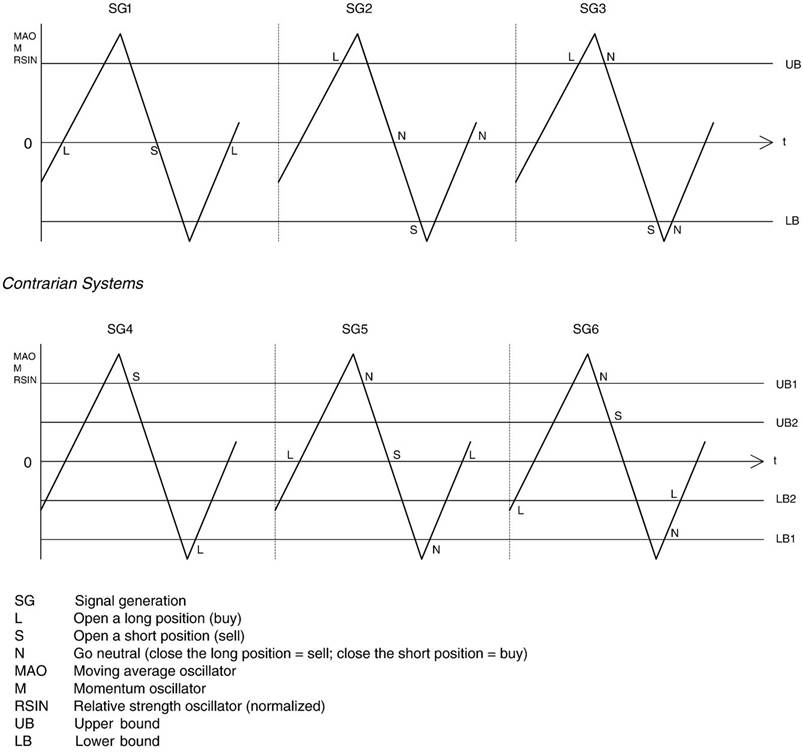
Rule SG 3 differs from SG 2 insofar as the former switches from an open to a neutral position earlier. Whenever the oscillator crosses the upper (lower) band from above (below) rule SG 3 turns from long (short) to neutral. A momentum oscillator, e.g., closes a long position even if the current price still exceeds the price i days ago, provided that the (positive) rate of change [(Pt−Pt−i)/Pt−i ]⁎100 is declining and falls below the level of the upper bound.
The trading rules SG 4 to 6 are contrarian since they try to identify “overbought” (“oversold”) situations. An overbought situation is indicated when the oscillator is falling below a certain—still positive—level. If the oscillator is rising—though still negative—the situation is considered oversold once the oscillator crosses the lower bound from below. Fig. 1 shows the differences between the 3 contrarian trading rules.
|
Fig. 1. Signal generation of technical trading systems. SG Signal generation, L Open a long position (buy), S Open a short position (sell), N Go neutral (close the long position=sell; close the short position=buy), MAO Moving average oscillator, M Momentum oscillator, RSIN Relative strength oscillator (normalized), UB Upper bound, LB Lower bound. |
Rule SG 4 is always either long or short (as is the
trend-following rule SG 1). According to SG 4 a trader switches from a long
(short) to a
short (long) position once the oscillator crosses the upper (lower) bound from above (below). Hence, even if the rate of price change in the case of a momentum model is still positive the model SG 4 switches from a long to a short position once the rate of price change falls below the level of the upper bound.
Rule SG 5 is more “cautious” than SG 4 insofar as the former goes at first neutral when the oscillator penetrates the upper (lower) bound from above (below), and switches to a short (long) position only if the oscillator penetrates the zero line.
Rule SG 6 operates with a second (inner) band marked by UB2 and LB2 (UB1>UB2>LB2>LB1). This model holds a neutral position whenever a falling (rising) oscillator lies between UB1 and UB2 (LB1 and LB2) and, hence, is less often neutral as compared to SG 5. Rule SG 6 can be considered a combination of SG 4 and SG 5. At the extreme values of UB2 (LB2) the model SG 6 is identical either with SG 4 (when UB2=UB1 and LB2=LB1) or with SG 5 (when UB2=LB2=0).
One of the most popular indicators for identifying overbought and oversold conditions is the so-called Relative Strength Index (RSI). Since the strategy of following this index is contrarian only the trading rules SG 4 to SG 5 can be applied. The n-day RSI is defined as follows (Kaufman, 1987, p. 99).
RSIð Þn t = 100 −f100= ½1 + Uptð Þn = Downtð Þn g ð3Þ
Where
Upt(n), Downt(n) are the average positive or negative price changes within the interval of n days (or of n 30-minutes-periods).
|
DownUptð Þntð Þ=n =P DPi =Dni = n |
for Di > 0 for Di < 0 |
And
Di is the daily (30-minutes) price change:
Di = Pt−i + 1 − Pt−i for i = 1:::::::n
The size of the RSI(n) oscillator does not only depend on the overall price change Pt−Pt−n (as the momentum oscillator) but also on the degree of monotonicity of this change, e.g., the less countermovements occur during an upward (downward) trend the higher (lower) is RSI(n) for any given price change Pt−Pt−n. If the RSI(n) falls (rises) again below (above) a certain level (the upper/lower bound of the RSI oscillator) the situation is considered overbought (oversold).[4]
The original RSI fluctuates between 0 and 100. To make this oscillator comparable to the moving average and the momentum oscillator, respectively, one can calculate a normalized RSI (=RSIN) which fluctuates around zero:
RSINð Þn t = 1ð = 100Þ4½RSIð Þn t − 5042 ð4Þ
Уважаемый посетитель!
Чтобы распечатать файл, скачайте его (в формате Word).
Ссылка на скачивание - внизу страницы.