Significant variability of feed water salinity, as indicated by feed conductivity variation of 1200–2019S/cm (or approximately ∼744–1252mg/L TDS) was observed during Phase II testing (Fig. 4), with a corresponding variability of the PRO concentrate over a range of 5035–8390S/cm (or approximately ∼3122–5202mg/L TDS). In the PRO concentrate, produced from 83% PRO recovery, the dissolved constituents were at a concentration factor of approximately 5.8 relative to the PRO feed(Eq.(1)).Therefore,arelativelysmallvariationofPROfeed
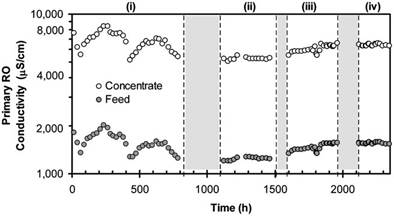
Fig. 4. Variations in primary RO influent (feed) and effluent (concentrate) water quality, expressed as conductivity (S/cm), during Phase II pilot testing. Shaded regions denote periods when the pilot unit operation was shut down due to operational issues with the system.
water composition would have resulted in a significant change in the PRO concentrate water quality. For example, a 20mg/L variation in raw-water Ca2+ concentration would have resulted in an approximately 116mg/L change in Ca2+ concentration in the PRO concentrate, which was subsequently fed to the SCR. Given that chemical demineralization in the SCR was governed by CaCO3 precipitation, induced by the addition of NaOH, variations of the SCR influent quality (e.g., Ca2+ concentration and HCO3− alkalinity) were expected to affect the performance of the SCR. The operating strategy was a once daily adjustment of the NaOH dosing, established based on pH monitoring via periodic sampling of the SCR effluent. However, the data (Fig. 5a) suggests that this operational mode was suboptimal to provide a consistentSCRpHlevel,giventhevariabilityoffeedwaterquality (e.g., alkalinity, TDS and Ca2+) in addition to potential drift of the NaOH metering pump and atmospheric CO2 exchange at the SCR. Substantial variation of SCR effluent pH occurred
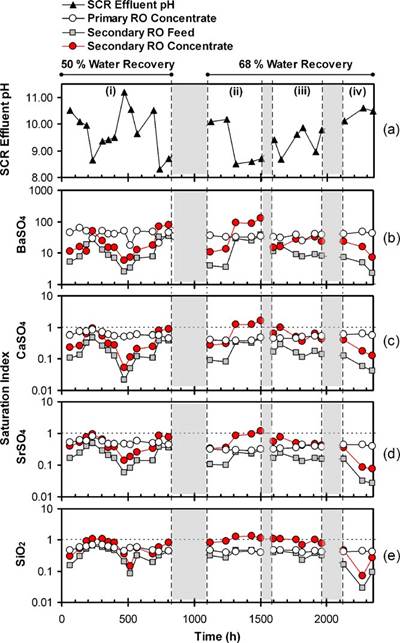
Fig. 5. Variability of (a) SCR effluent pH and saturation indices for (b) BaSO4, (c) CaSO4, (d) SrSO4, and (e) SiO2 in the primary RO concentrate, secondary RO feed, and secondary RO concentrate during Phase II pilot testing. Membrane elements were replaced after 830h of operation. Secondary RO was operated at 50% or 68% water recoveries at time periods of 0–830h and 1100–2350h, respectively. Shaded regions denote periods of plant shut downs.
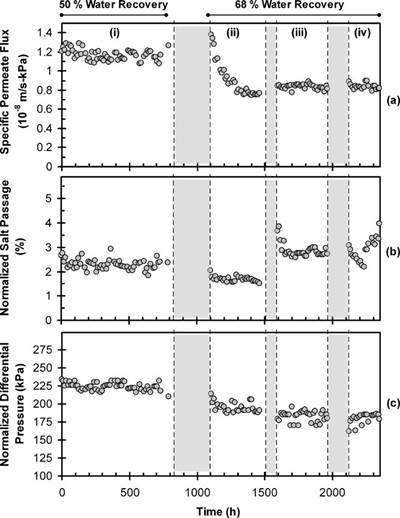
Fig. 6. (a) Specific permeate flux, (b) normalized salt passage, and (c) normalized differential pressure of the RO brine channel during secondary RO desalting (Phase II pilot testing). Membrane elements were replaced after 830h of operation. Secondary RO was operated at 50% or 68% water recoveries at time periods of 0–830h and 1100–2350h, respectively. Shaded regions denote periods of plant shut downs.
and, in some cases, the pH decreased to less than 9 (Fig. 5a). The demineralization efficiency decreased with decreasing pH as previously established during Phase I testing (Fig. 3). Clearly, the performance data from Phase II suggests the necessity for a robust operation and feed-back control strategy to precisely control the SCR effluent pH in order to better handle temporal process variations.
In order to assess the efficiency of the SCR and the scaling potential in the SRO desalting stage (operated at 50% and 68% water recoveries), the saturation indices of BaSO4, CaSO4, and SiO2 were calculated, based on multi-electrolyte thermodynamic analysis [12,19] for the PRO concentrate, the SRO feed (i.e., pH adjusted SCR filtered effluent), and SRO concentrate streams (see Fig. 2). Due to variations in the PRO feed water quality, the saturation indices for BaSO4, CaSO4, SiO2, and SrSO4 in the PRO concentrate (i.e., SCR influent prior to pH adjustment; Fig. 5b–e) varied within the ranges of 17–63, 0.4–0.9, 0.4–0.7, and 0.3–0.8, respectively. As a result, variations of the saturation indices of these minerals for the SRO feed (i.e., pH adjusted SCR filtered effluent) were in the range of 2.2–38, 0.02–0.5, 0.03–0.7, and 0.03–0.5 for BaSO4, CaSO4, SiO2, and SrSO4, respectively. However, the saturation indices for the latter three mineral salts were maintained below unity.
Уважаемый посетитель!
Чтобы распечатать файл, скачайте его (в формате Word).
Ссылка на скачивание - внизу страницы.