Diagnostics |
Диагностика |
|
Electrocardiograms and Cardiac Angiography |
ЭКГ и коронарная ангиография |
|
A basic understanding of this physiology is needed to interpret cardiac ai-rhythmias. Discussion of electrocardiography should begin with a review of electrophysiology. |
Для правильной интерпретации нарушений ритма сердца необходимо знать основы электрофизиологии. |
|
The cardiac myofibril is the basic contractile unit of the heart. Through the synchronized contractions of these myofibrils, the atrial and ventricular contractions occur that pump the blood through the heart and out to the lungs and body. |
Основная сократительная единица миокарда – мышечное волокно. |
|
The resting cell sits ready to respond to stimulation. This is termed excitability. In this resting state, the cell membrane has a potential energy known as a resting membrane potential or transmembrane potential. This is an electrical gradient. Stimulation activates a rapid sequence of events known as the action potential. There is a sudden loss in the transmembrane potential. This is depolarization. It is caused by a change in the cell membrane permeability to sodium (Na*). Upon stimulation, sodium flows into the cell in an effort to reach neutrality. Potassium (K*) flows out of the cell, to an area of lesser concentration, to replace Na*. |
Кардиомиоцит, находящийся в состоянии покоя, потенциально способен к сокращению, т.е. имеет свойство возбудимости. В таком состоянии мембрана кардиомиоцита имеет электрический потенциал, называемый потенциалом покоя. При стимуляции происходит деполяризация, возникает потенциал действия. |
|
The cell's intracellular fluid becomes positively charged. The "sodium pump" of the cell membrane begins to transport Na* out of the cell and K.* into the cell to return it to the original concentrations. This returns the cell to its resting state. This is the process of : In summary, depolarization is when contraction occurs and the heart is in systole. Repolarization is when the cell returns to its resting state and the heart is in diastole. |
|
|
The impulse that stimulates the cardiac myofibrils comes from cells that specialize in impulse production. These cells have an unstable membrane potential, while those that contract have a stable membrane potential. These automatic cells have spontaneous depolarization. Automaticity is spontaneous depolarization without external stimulus. The impulse these cells produce travels from one myofibril to the next, each stimulating the next, or through tracks of cells that specialize in impulse conduction. The latter is a much faster means of impulse conduction. |
|
|
The impulse that causes the heart to contract normally originates from the sinoatrial (S-A) node. The S-A node is located in the right atrium at the junction with the superior vena cava. The normal adult rate is 60-100 beats per minute. The following text will examine the heart as the impulse travels through the heart and the corresponding electrocardiograph (ECG) tracing. |
|
|
Electrocardiograms |
Электрокардиографическая диагностика |
|
The release of the impulse from the S-A node causes the surrounding myofibrils to depolarize and contract. As the impulse travels across the atrium from cell to cell the ECG has an upward deflection known as the Pwave. |
|
|
The impulse travels through the cells, reaches the atrioventricular (A-V) node and causes it to depolarize. The A-V node is located in the inferior intra-atrial septum. Its function is to relay the signal from the atria to the ventricles. The small electrical activity as the impulse travels through the A-V node is not sensed on the ECG, so it is represented graphically by a straight line or an isoelectric line after the P wave. |
|
|
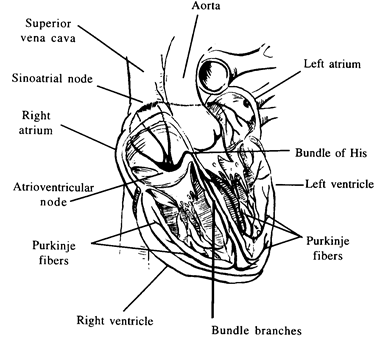
Electrical Conduction Paths |
Проводящая система сердца |
|
|
|
|
The impulse next travels through a track known as the bundle of His. This divides in the ventricular septum into the right and left bundle branches. These'terminate in the smallest branches known as Purkinje fibers, which go throughout the heart muscle walls. This impulse causes ventricular depolarization and contraction. This depolarization travels from the inside to the outside of the ventricles and is displayed by the QRS complex. |
|
|
There is then a brief period of inactivity, S-T segment, then repolarization of the ventricles occurs. This is seen on the ECG as the T wave. There is occasionally another wave after the T known as the U wave. It is very small and often associated with cardiomyopathy, decreased serum potassium or decreased serum calcium. |
|
|
|
|
|
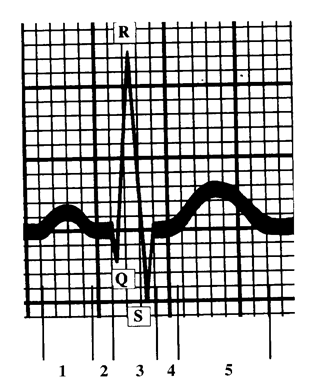
1 - P wave |
|
|
2 - P-R segment (Isoelectric line) |
|
|
3 - QRS complex |
|
|
4 - S-T segment |
|
|
5 - T wave |
|
|
1 & 2 - P-R interval |
|
|
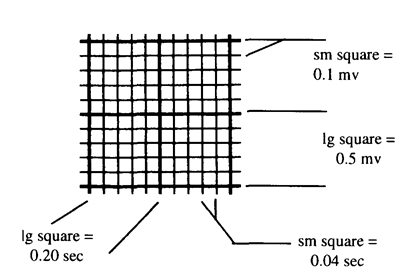
The ECG is recorded on ruled paper. This allows measurements of duration and strength of particular wave forms. Standard paper has dark thick lines which form squares. These are subdivided into smaller blocks (1mm), five between each set of dark lines. |
|
|
The horizontal axis is used when measuring time. Each of the small squares = 0.04 seconds. Therefore, the time between dark lines = 0.20 seconds (5 x 0.04 = 0.20). |
|
|
The strength of a signal is measured on the vertical axis. Here each small square = 0.1 mv, and between dark lines = 0.5 mv. |
|
|
|
|
|
The measurements of both time and strength can have significance |
|
|
on certain portions of the ECG tracing. The normal values for duration are |
|
|
listed below. |
|
|
Pwave 0.08-0.12 second |
|
|
ORS complex 0.08 - 0.10 second |
|
|
Twave 0.20 second |
|
|
P - R interval 0.12 - 0.20 second |
|
|
(from the beginning of the P wave to the beginning of the QRS complex) |
|
|
S - T segment 0.12 - 0.15 second (from the end of the QRS to the beginning of the T wave, ventricle contraction) |
|
|
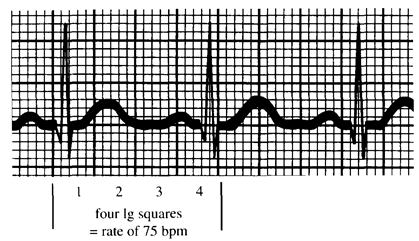
There are several methods of determining heart rates. There are rulers that can be used to measure between beats, but these rulers are easily misplaced. The two easiest methods are the grid and scan methods. |
|
|
The grid method is determining rate by looking at two consecutive beats and determining the number of dark grid lines between them. If the QRS does not fall on a dark line. calipers may be useful to measure the distance. An example and the table of values are listed below. |
|
|
|
Уважаемый посетитель!
Чтобы распечатать файл, скачайте его (в формате Word).
Ссылка на скачивание - внизу страницы.