assumption by pressing the alternate mouse button and selecting
Analysis Options.
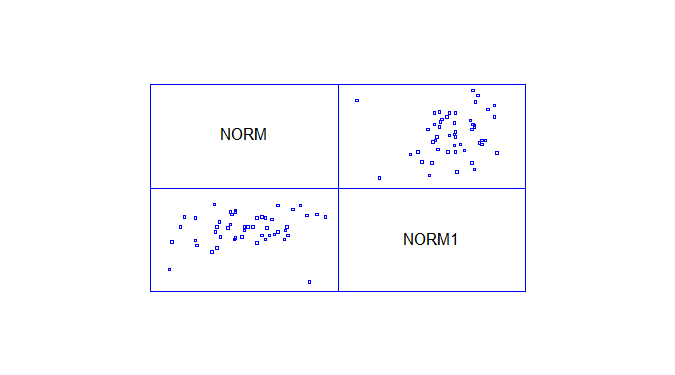
Multiple-Variable Analysis
Analysis Summary
Data variables:
NORM
NORM1
All available data will be used in each calculation.
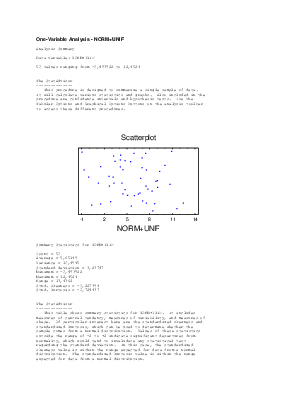
The StatAdvisor
--------------This procedure is designed to summarize several columns of
quantitative data. It will calculate various statistics, including
correlations, covariances, and partial correlations. Also included in
the procedure are a number of multivariate graphs, which give
interesting views into the data. Use the Tabular Options and
Graphical Options buttons on the analysis toolbar to access these
different procedures.
After this procedure, you may wish to select another procedure to
build a statistical model for your data. Depending on your goal, one
of several procedures may be appropriate. Following is a list of
goals with an indication of which procedure would be appropriate:
GOAL: build a model for predicting one variable given values of one of
more other variables.
PROCEDURE: Relate - Multiple regression
GOAL: group rows of data with similar characteristics.
PROCEDURE: Special - Multivariate Methods - Cluster Analysis
GOAL: develop a method for predicting which of several groups new rows
belong to.
PROCEDURE: Special - Multivariate Methods - Discriminant Analysis
GOAL: reduce the number of columns to a small set of meaningful
measures.
PROCEDURE: Special - Multivariate Methods - Factor Analysis
GOAL: determine which combinations of the columns determine most of
the variability in your data.
PROCEDURE: Special - Multivariate Methods - Principal Components
GOAL: find combinations of the columns which are strongly related to
each other.
PROCEDURE: Special - Multivariate Methods - Canonical Correlations
Summary Statistics
NORM NORM1
---------------------------------------------------------------------------------------------------Count 50 100
Average 5,4129 7,33179
Variance 10,4291 12,8407
Standard deviation 3,22942 3,58339
Minimum -1,17424 -6,42515
Maximum 12,0278 16,118
Range 13,202 22,5431
Stnd. skewness -0,243147 -2,42522
Stnd. kurtosis -0,794814 3,686
---------------------------------------------------------------------------------------------------The StatAdvisor
--------------This table shows summary statistics for each of the selected data
variables. It includes measures of central tendency, measures of
variability, and measures of shape. Of particular interest here are
the standardized skewness and standardized kurtosis, which can be used
to determine whether the sample comes from a normal distribution.
Values of these statistics outside the range of -2 to +2 indicate
significant departures from normality, which would tend to invalidate
many of the statistical procedures normally applied to this data. In
this case, the following variables show standardized skewness values
outside the expected range:
NORM1
The following variables show standardized kurtosis values outside the
expected range:
NORM1
To make the variables more normal, you might try a transformation such
as LOG(Y), SQRT(Y), or 1/Y.
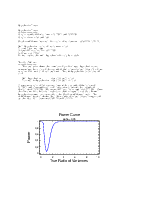
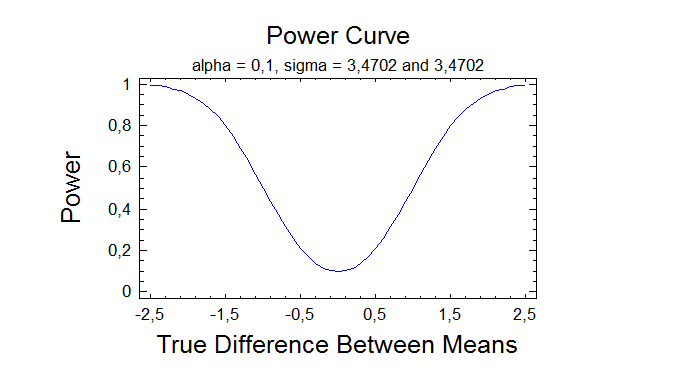
Hypothesis Tests
Hypothesis Tests
---------------Sample standard deviations = 3,22942 and 3,58339
Sample sizes = 50 and 100
95,0% confidence interval for ratio of variances: [0,508453;1,35134]
Null Hypothesis: ratio of variances = 1,0
Alternative: not equal
Computed F statistic = 0,812196
P-Value = 0,423201
Do not reject the null hypothesis for alpha = 0,05.
The StatAdvisor
--------------This analysis shows the results of performing a hypothesis test
concerning the ratio of the standard deviations (sigma1/sigma2) of two
samples from normal distributions. The two hypotheses to be tested
are:
Null hypothesis: sigma1/sigma2 = 1,0
Alternative hypothesis: sigma1/sigma2 <> 1,0
Given one sample of 50 observations with a standard deviation of
3,22942 and a second sample of 100 observations with a standard
deviation of 3,58339, the computed F statistic equals 0,812196. Since
the P-value for the test is greater than or equal to 0,05, the null
hypothesis cannot be rejected at the 95,0% confidence level. The
confidence interval shows that the values of sigma1/sigma2 supported
Уважаемый посетитель!
Чтобы распечатать файл, скачайте его (в формате Word).
Ссылка на скачивание - внизу страницы.