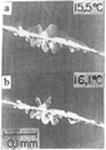
Figure 3 Melting behavior of the β phase.
Similar differences were observed in X-ray diffraction profiles, as shown in Figure 4. The specimen crystallized at 11.0 °C showed very weak reflections due to long spacings for 2θ < 10°. These reflections increased in intensity after standing at 15.5 °C for 2 days. Reflections in the region of 15 < 2θ < 30° also became sharper with some of them being split into doublets. However, the overall diffraction pattern has not changed much.
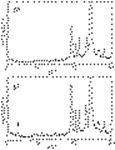
Figure 4 X-ray powder diffraction patterns of β1 and β2.
From the above experimental results, we conclude that the β phase of oleic acid can be classified into two phases, β1 (mp 16.3 °C) and β2 (mp 16.0 °C). We have already reported a complex solution−crystallization mechanism of n-fatty acids accompanying a solid-state phase transition from a metastable phase to a stable phase.19,20 We now infer that a similar phenomenon also takes place during the melt crystallization of the β phase, i.e., the stable phase β1 was generated via a metastable state β2. At first the crystal grows as the β2 phase followed by the transformation of the β2 phase to the β1 phase through a solid-state phase transition. The observation that only a portion near the growing end melts at 16.0 °C (Figure 3) supports this interpretation. We therefore considered that the crystal grows as β1 only in the vicinity of the melting point (16.3 °C).
Crystal Structure of β1. The experimental conditions and the cell parameters are summarized in Table 1, and the coordinates of non-hydrogen atoms are listed in Table 2.
Table 1: Crystallographic Data of Oleic Acid β1 Phase
|
molecular formula |
C18H34O2 |
|
Mr |
564.90 |
|
Dx |
1.04 Mg m-3 |
|
a (Å) |
9.317(2) |
|
b |
5.543(2) |
|
c |
35.284(1) |
|
α (deg) |
87.90(3) |
|
β |
82.82(3) |
|
γ |
86.18(3) |
|
F(000) |
632 |
|
μ |
0.499 |
|
cell volume (Å3) |
1803.1(8) |
|
space group |
P |
|
molecules/unit cell |
4 |
|
cell measurement temp |
263 K |
|
single crystals were obtained from acetonitrile |
Table 2: Fractional Coordinates of Non-H Atoms and Equivalent Isotropic Temperature Factors with Estimated Standard Deviations in Parentheses
|
|
Уважаемый посетитель!
Чтобы распечатать файл, скачайте его (в формате Word).
Ссылка на скачивание - внизу страницы.
