Powder X-ray Diffraction. A powder X-ray diffraction pattern was taken with a Rigaku-Denki diffractometer with Cu Kα radiation monochromatized with a graphite monochromator. Samples were cooled at about −10 °C with a Rigaku-Denki cryostat.
X-ray Crystal Structure Analysis. A plate crystal of dimensions 0.7 × 0.5 × 0.2 mm3 was used for intensity measurements. Specimens were cooled with a stream of dry air. Intensity data were obtained with a Rigaku-Denki AFC-5 automated four-circle diffractometer with Ni-filtered Cu Kα radiation from a rotating anode. Unit cell parameters were refined using the 2θ values of 24 reflections in the range 19 < 2θ < 24°. Reflections with 4 < 2θ < 120° (−10 < h <10, 0 < k < 6, −38 < l <39) were measured with ω-scan mode with a scan speed of 3 deg min-1. The scan range is (1.6−0.1 tan θ)°. A total of 4593 reflections were collected. A quantity of 2873 observed reflections with the criterion of I > 2σ(I) were used in the refinement. No absorption correction was performed. The initial coordinates of 20 carbon atoms were located by using the program SHELXS-93.16 For least-squares calculations SHELXS-8617 was used. The other atoms were located after several cycles of least-squares refinement and Fourier calculation. The initial coordinates of hydrogen atoms were geometrically calculated. The B factors of 68 hydrogen atoms were refined isotropically. ∑w(Io − Ic)2 was minimized. The weighting scheme is w = 1/[σ(Io)2 + (0.1070P)] where P = (Io + 2Ic)/3. A sample of 565 parameters were used for refinement. Ro is 0.057 and Rw is 0.155. Δmax/σ is 0.089 and Δave/σ is 0.013. Atomic scattering factors were from International Tables for X-ray Crystallography (1974, Vol. IV). ORTEP II18 was used for plotting the crystal structure.
·
o Top of Page
o Introduction
o Experimental Section
o Results
o Discussion
o Supporting Information Available
Results
Growth Mechanism. On melt crystallization the morphology of the growing single crystals of β depends remarkably on supercooling. As shown in Figure 2a, the crystals of β do not have a definite shape below 13 °C. The β phase grows as an agglomerate of fine curved crystals. At about 14 °C crystals start to grow as straight serrated rod crystals (Figure 2b). At a slightly higher temperature triangle-shaped crystals appear at the lateral sides of the rod crystal (Figure 2c) and the lateral sides appears as a sawtooth. The sawtoothed edges become a straight line above 15.0 °C, and a ridge extending toward the growing crystal end appears in the center of the crystal face. This center ridge becomes obscured with increasing temperature, and single crystals tend to develop in the lateral direction. An isolated single-crystal exhibits a hexagon-shaped morphology at 15.5 °C (Figure 2d). These remarkable morphological changes (parts b−d of Figure 2) take place in a very narrow temperature range 14.1−15.5 °C, which is the phenomenon characteristic of the β phase.
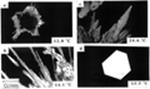
Figure 2 Temperature dependence of morphology.
Another important result is that the β phase can be divided into two phases slightly different from each other in melting point. Figure 3 shows the behavior on melting of oleic acid β. A rod-shaped crystal was retained at 15.5 °C. After a few minutes the center of the rod began to grow in the lateral direction (Figure 3a). When this crystal was heated from 15.5 to 16.1 °C with a rate of 0.3 °C/min, the lateral flat part melted to some extent at 16.0 °C (Figure 3b). However, the rod and the early developed flat region did not melt at 16.0 °C but did at 16.3 °C. The crystal grown below 14.0 °C completely melted at 16.0 °C when the crystal was heated just after the crystallization. We found also that the β phase exhibited systematically two different values of the heat of fusion. For example, a specimen crystallized at 11.0 °C melts at about 15.9 °C and the heat of fusion ΔHfus is 48.9 kJ/mol. On the other hand, a specimen crystallized at 15.5 °C melts at 16.3 °C and ΔHfus is 51.9 kJ/mol. When a specimen grown below 14.0 °C is held at 15.5 °C, the melting point and the heat of fusion approach 16.3 °C and 51.9 kJ/mol, respectively, with increasing holding time.
Уважаемый посетитель!
Чтобы распечатать файл, скачайте его (в формате Word).
Ссылка на скачивание - внизу страницы.