1. BASIC SOCIAL AND ECONOMIC CHARACTERISTICS OF THE RUSSIAN FEDERATION
|
Capital city – Moscow Russia covers Eastern Europe and Northern Asia Area1)–17098.2 thou. sq. km (as of January 1, 2011 agricultural land occupied 13%, forest land – 51%, surface waters including swamps– 13%) Population as of January 1, 2012 – 143056.4 thou. persons Population density as of 1 January 2012 – 8.4 persons per one sq. km Maximum stretch, thou. km: longitudinal – 4 latitudinal – 9 Russia is bounded by: Arctic Ocean seas (Barents, White, Kara, Laptev, East Siberian, Chukchi seas); Pacific Ocean seas (Bering, sea of Оkhotsk, sea of Japan); Atlantic Ocean seas (Baltic, Black, sea of Azov) The largest islands, thou. sq. km : Novaya Zemlya 82.6 Sakhalin 76.4 New Siberian 38 Severnaya Zemlya 37 |
State borders: in the North West - with Norway and Finland; in the West - with Poland, Estonia, Latvia, Lithuania and Belarus; in the South West - with Ukraine; in the South - with Abkhazia, Georgia, South Osetia, Azerbaijan and Kazakhstan; in the South East - with China, Mongolia and the Democratic People’s Republic of Korea; in the East (sea borders) - with USA and Japan The longest rivers 2) , km: |
|
|
Lena Yenisey (with Angara) Volga Ob’ Amur |
4337 3844 3694 3676 2855 |
|
|
The largest lakes 3), thou. sq. km : |
||
|
Baikal Ladoga Onega |
31.5 17.7 9.7 |
|
|
The highest mountain, m: |
||
|
Elbrus |
5642 |
|
|
Average temperatures: January from 0°C to minus 5°C (North Caucasus) about minus 40–50°C (East of the Republic of Sakha (Yakutia); the lowest temperatures reach minus 65–70°C in this region); July from 1°С (Northern coast of Siberia) to 24–25°С (Kaspian plain) |
||
|
As for its territory, the Russian Federation ranks the first in the world, as for its population4) - the eighth, as for GDP PPP5) (estimated in USA Dollars) - the eighth. |
||
¾¾¾¾¾¾
1) Data from Rosreestr.
2) Data from statistical handbook of Rosvodresursy «Water resources of Russia in 2010».
3) Data from Rosvodresursy.
4) Data from 2010 Russia population census.
5) According to results of international comparisons for 2005.
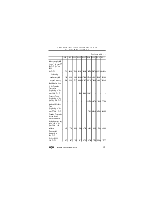
1.1. BASIC SOCIAL AND ECONOMIC INDICATORS1)
|
1992 |
1995 |
2000 |
2005 |
2007 |
2008 |
2009 |
2010 |
2011 |
|
|
Population, (end of the year)2), mln. persons |
148.6 |
148.3 |
146.3 |
142.8 |
142.0 |
141.9 |
141.9 |
142.9 |
143.0 |
|
Natural increase, decrease (-) of population: |
|||||||||
|
thou. persons |
-219.8 |
-840.0 |
-958.5 |
-846.5 |
-470.3 |
-362.0 |
- 248.8 |
-239.6 |
-131.2 |
|
per 1000 persons3) |
-1.5 |
-5.7 |
-6.6 |
-5.9 |
-3.3 |
-2.5 |
- 1.8 |
-1.7 |
-0.9 |
|
Migration increase of population, thou. persons |
176.1 |
502.2 |
213.6 |
107.4 |
239.9 |
242.1 |
247.4 |
158.1 |
320.0 |
|
Average annual number of employed in the economy 4), thou. persons |
71905 |
66330 |
64517 |
66792 |
68019 |
68474 |
67463 |
67577 |
67932 |
|
including those at enterprises of non-state forms of ownership (except municipal) and individual sector |
22245 |
38385 |
40145 |
44292 |
46223 |
46944 |
46366 |
47011 |
47755 |
|
Number of unemployed 5), thou. persons |
3889 |
6684 |
7700 |
5263 |
4589 |
4792 |
6373 |
5636 |
5020 |
|
Unemployed, officially registered by government employment service(end of the year)6), thou. persons |
578 |
2327 |
1037 |
1830 |
1553 |
1522 |
2147 |
1589 |
1286 |
|
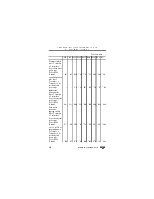
Continued table 1.1 |
|||||||||
|
1992 |
1995 |
2000 |
2005 |
2007 |
2008 |
2009 |
2010 |
2011 |
|
|
Number of pensioners 7) (end of the year), thou. persons |
35273 |
37083 |
38411 |
38313 |
38467 |
38598 |
39090 |
39706 |
40162 |
|
Average per capita money income of population3), RUR per month (before 2000 – thou. RUR) |
4.0 |
515.9 |
2281 |
8112 |
12603 |
14948 |
17009 |
18887 |
20701 |
|
Average per capita money expenditures of population 3), RUR per month (before 2000 – thou. RUR) |
3.4 |
497.1 |
2218 |
7992 |
12118 |
14898 |
16948 |
18514 |
20378 |
|
Accrued average monthly nominal wages of employees of organizations, RUR (before 2000 – thou. RUR) |
6.0 |
472.4 |
2223 |
8555 |
13593 |
17290 |
18638 |
20952 |
23693 |
|
Average pension (1995, 2000 – with compensations), RUR (before 2000 – thou. RUR) |
1.6 |
188.1 |
694.3 |
2364 |
3116 |
4199 |
5191 |
7476 |
8203 |
|
Gross Domestic Product: |
|||||||||
|
total, bln. RUR (before 2000 – trln. RUR) |
19 |
1429 |
7306 |
21610 |
33248 |
41277 |
38807 |
45173 |
54586 |
|
per capita 3) RUR (before 2000 – thou. RUR) |
128 |
9628 |
49835 |
150997 |
233948 |
290771 |
273465 |
316137 |
381822 |
Continued table 1.1
|
1992 |
1995 |
2000 |
2005 |
2007 |
2008 |
2009 |
2010 |
2011 |
|
|
Final consumption expenditures, bln. RUR (before 2000 – trln. RUR) |
9.2 |
1016.6 |
4476.8 |
14438.2 |
21968.6 |
27543.5 |
29269.6 |
32149.9 |
37254.9 |
|
Gross capital formation, bln. RUR (before 2000 – trln. RUR) |
6.6 |
363.4 |
1365.7 |
4338.7 |
8034.1 |
10526.1 |
7344.8 |
10288.3 |
13644.4 |
|
Fixed assets in the economy, at book value (end of the year; 1992 – with the revaluation as of 1.07.1992), bln. RUR (before 2000 - trln. RUR) |
43.2 |
5306 |
17464 |
41494 |
60391 |
74441 |
82303 |
93186 |
101938 |
|
Shipment of own production goods, works, performed and services rendered by economic activity 8), bln. RUR: |
|||||||||
|
mining and quarrying |
… |
… |
… |
3062 |
4489 |
5272 |
5091 |
6212 |
7876 |
|
manufacturing |
… |
… |
… |
8872 |
13978 |
16864 |
14352 |
18287 |
21893 |
|
electricity, gas and water supply |
… |
… |
… |
1691 |
2146 |
2573 |
3030 |
3616 |
3909 |
Continued table 1.1
|
1992 |
1995 |
2000 |
2005 |
2007 |
2008 |
2009 |
2010 |
2011 |
|
|
Agricultural output, bln. RUR (before 2000 – trln. RUR) |
2.7 |
203.9 |
742.4 |
1380.9 |
1931.6 |
2461.4 |
2515.9 |
2618.5 |
3451.3 |
|
including: |
|||||||||
|
crop-growing products |
1.3 |
108.3 |
394.7 |
669.8 |
1002.4 |
1306.4 |
1238.9 |
1179.8 |
1853.7 |
|
animal breeding products |
1.4 |
95.6 |
347.7 |
711.1 |
929.2 |
1155.0 |
1277.0 |
1438.7 |
1597.6 |
|
Residential houses put in place, total floor space, mln. sq. m |
41.5 |
41.0 |
30.3 |
43.6 |
61.2 |
64.1 |
59.9 |
58.4 |
62.3 |
|
Freight turnover of transport, trln. tons-km |
4.9 |
3.7 |
3.6 |
4.7 |
4.9 |
4.9 |
4.4 |
4.8 |
4.9 |
|
Passenger turnover of public transport, bln. passenger-km |
681.2 |
552.3 |
496.2 |
473.3 |
497.3 |
512.2 |
464.29) |
483.89) |
502.6 |
|
Retail trade turnover 10), bln. RUR (before 2000 – trln. RUR) |
5.1 |
512 |
2352 |
7041 |
10869 |
13944 |
14599 |
16499 |
19083 |
|
Market services rendered to population, bln. RUR (before 2000 – trln. RUR) |
0.5 |
113 |
603 |
2272 |
3425 |
4080 |
4504 |
485111) |
542511) |
|
Revenues of consolidated budget: |
|||||||||
|
bln. RUR (before 2000 - trln. RUR) 12) |
5.3 |
437.0 |
2097.7 |
8579.6 |
13368.3 |
16003.9 |
13599.7 |
16031.9 |
20855.4 |
Continued table 1.1
|
1992 |
1995 |
2000 |
2005 |
2007 |
2008 |
2009 |
2010 |
2011 |
|
|
percentage of GDP |
28.0 |
30.6 |
28.7 |
39.7 |
40.2 |
38.8 |
35.0 |
35.5 |
38.2 |
|
Expenditures of consolidated budget: |
|||||||||
|
bln. RUR (before 2000 - trln. RUR)12) |
6.0 |
486.1 |
1960.1 |
6820.6 |
11378.6 |
13991.8 |
16048.3 |
17616.7 |
19994.6 |
|
percentage of GDP |
31.4 |
34.0 |
26.8 |
31.6 |
34.2 |
33.9 |
41.4 |
39.0 |
36.6 |
|
Surplus,deficit (-) of consolidated budget: |
|||||||||
|
bln. RUR (before 2000 - trln. RUR) 12) |
-0.7 |
-49.1 |
137.6 |
1759.0 |
1989.7 |
2012.1 |
-2448.6 |
-1584.7 |
860.7 |
|
as percentage of GDP |
3.4 |
3.4 |
1.9 |
8.1 |
6.0 |
4.9 |
-6.3 |
-3.5 |
1.6 |
|
Balanced financial result (profit less loss) of the economy 13) , mln. RUR (before 2000 - bln. RUR) |
5623 |
250599 |
1190597 |
3225916 |
6040922 |
3801161 |
4431609 |
6330589 |
7245580 |
Continued table 1.1
|
1992 |
1995 |
2000 |
2005 |
2007 |
2008 |
2009 |
2010 |
2011 |
|
|
Money supply M2 (end of the year)14), bln. RUR (before 2000 - trln. RUR) |
7.14 |
220.8 |
1150.6 |
6032.1 |
12869.0 |
12975.9 |
15267.6 |
20011.9 |
24543.4 |
|
including: |
|||||||||
|
cash money M0 |
1.68 |
80.8 |
418.9 |
2009.2 |
3702.2 |
3794.8 |
4038.1 |
5062.7 |
5938.6 |
|
deposit money |
5.46 |
140.0 |
731.7 |
4022.9 |
9166.7 |
9181.8 |
11229.5 |
14949.1 |
18604.8 |
|
Stabilization fund of the Russian Federation (beginning of the year), bln. RUR |
522.3 |
2346.9 |
3849.1 |
- |
- |
- |
|||
|
Reserve Fund (beginning of the year)15), bln. RUR |
3057.9 |
4027.6 |
1830.5 |
775.2 |
|||||
|
National Welfare Fund (beginning of the year)15), bln. RUR |
783.3 |
2584.5 |
2769.0 |
2695.5 |
|||||
|
Russian Federation international reserved assets, including monetary gold (end of the year), bln. US dollars |
4.5 |
17.2 |
28.0 |
182.2 |
478.8 |
426.3 |
439.5 |
479.4 |
498.6 |
|
Fixed capital investments, bln. RUR (before 2000 - trln. RUR) |
2.7 |
267 |
1165 |
3611 |
6716 |
8782 |
7976 |
915216) |
10777 |
Continued table 1.1
|
1992 |
1995 |
2000 |
2005 |
2007 |
2008 |
2009 |
2010 |
2011 |
|
|
Consumer prices index (December to December of the previous year), percentage (before 2000 - in times) |
26.1 |
2.3 |
120.2 |
110.9 |
111.9 |
113.3 |
108.8 |
108.8 |
106.1 |
|
Industrial producer price index (December to December of the previous year), percentage |
… |
… |
131.9 |
113.4 |
125.1 |
93.0 |
113.9 |
116.7 |
112.0 |
|
Agricultural producer price index (December to December of the previous year), percentage (before 2000 – in times) |
9.417) |
3.317) |
122.2 |
103.0 |
130.2 |
102.5 |
98.2 |
123.6 |
94.9 |
|
Construction production aggregated price index (December to December of the previous year), percentage (before 2000 – in times) |
16.117) |
2.5 |
135.9 |
112.1 |
117.4 |
116.9 |
100.1 |
109.1 |
108.0 |
|
Index of tariffs for cargo shipments (December to December of the previous year), percentage (before 2000 – in times) |
35.6 |
2.7 |
151.5 |
116.6 |
106.8 |
132.3 |
97.5 |
133.1 |
108.4 |
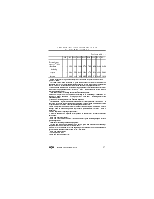
Continued table 1.1
|
1992 |
1995 |
2000 |
2005 |
2007 |
2008 |
2009 |
2010 |
2011 |
|
|
External trade turnover 18), bln. US dollars |
… |
145.0 |
149.9 |
369.2 |
577.9 |
763.5 |
495.2 |
649.2 |
845.2 |
|
including: |
|||||||||
|
exports |
… |
82.4 |
105.0 |
243.8 |
354.4 |
471.6 |
303.4 |
400.4 |
522.0 |
|
imports |
… |
62.6 |
44.9 |
125.4 |
223.5 |
291.9 |
191.8 |
248.7 |
323.2 |
1) Data in value terms are given at actual prices, since 2000 - at prices effective since January 1, 1998.
2) For 1992, 1995, 2000 estimation is given with account to results of 2002 Russia population census. For 2005-2009 without account to results of 2010 Russia population census. For 2010 – with account to results of the 2010 Russia population census.
3) For 2005-2009 indicators are estimated using population size without account to results of 2010 Russia population census, for 2010 – 2011 – with account to results of 2010 Russia population census.
4) Since 1995 to 2005 - excluding data for the Сhechen Republic.
5) Data from Sample Survey on Employment (according to ILO methodology): 1992,1995 – as of end of October, 2000-2011 – average per year. Since 2007 – including data for the Сhechen Republic.
6)Since 2005 - including data for the Сhechen Republic.
7) For 1992-2000 – registered officially in the bodies of social protection, since 2005 – in the system of Pension Fund of the Russian Federation. For 2007-2008 and 2010-2011 data is represented as of January 1 the year following the reference year.
8) Data is adjusted in line with results of annual statistical reports, and with a view to changes made by economic agencies to previously presented data, For 2011 – data is preliminary.
9) Data is adjusted by reporting organizations.
10) Data for 2008-2010 is adjusted by responders in annual forms
Уважаемый посетитель!
Чтобы распечатать файл, скачайте его (в формате Word).
Ссылка на скачивание - внизу страницы.