One-Variable Analysis - NORM+UNIF
Analysis Summary
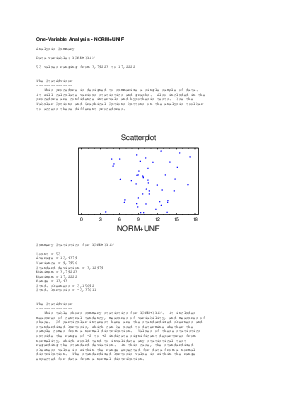
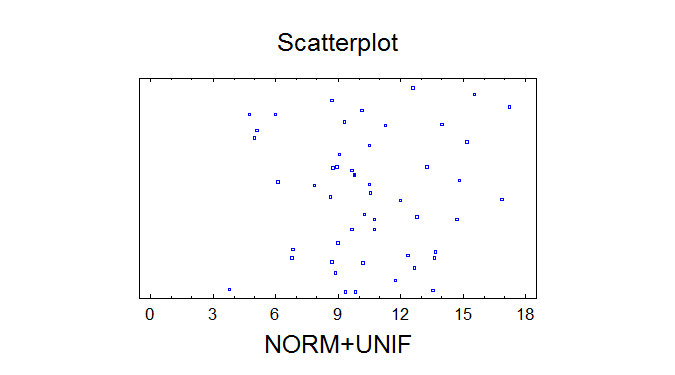
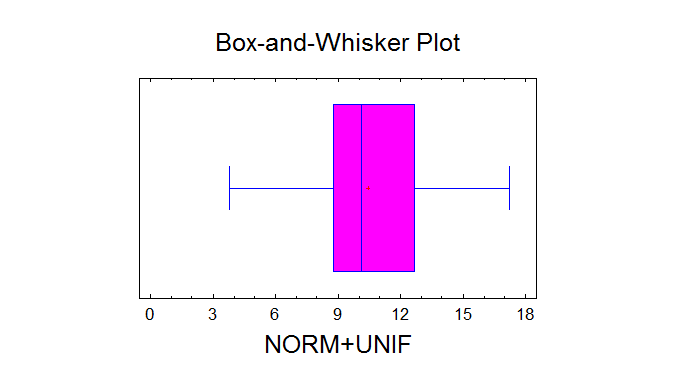
Data variable: NORM+UNIF
50 values ranging from 3,79223 to 17,2222
The StatAdvisor
--------------This procedure is designed to summarize a single sample of data.
It will calculate various statistics and graphs. Also included in the
procedure are confidence intervals and hypothesis tests. Use the
Tabular Options and Graphical Options buttons on the analysis toolbar
to access these different procedures.
Summary Statistics for NORM+UNIF
Count = 50
Average = 10,4379
Variance = 9,7956
Standard deviation = 3,12979
Minimum = 3,79223
Maximum = 17,2222
Range = 13,43
Stnd. skewness = 0,15692
Stnd. kurtosis = -0,37611
The StatAdvisor
--------------This table shows summary statistics for NORM+UNIF. It includes
measures of central tendency, measures of variability, and measures of
shape. Of particular interest here are the standardized skewness and
standardized kurtosis, which can be used to determine whether the
sample comes from a normal distribution. Values of these statistics
outside the range of -2 to +2 indicate significant departures from
normality, which would tend to invalidate any statistical test
regarding the standard deviation. In this case, the standardized
skewness value is within the range expected for data from a normal
distribution. The standardized kurtosis value is within the range
expected for data from a normal distribution.
Hypothesis Tests for NORM+UNIF
Sample mean = 10,4379
Sample median = 10,1548
t-test
-----Null hypothesis: mean = 10,0
Alternative: not equal
Computed t statistic = 0,989392
P-Value = 0,327332
Do not reject the null hypothesis for alpha = 0,05.
sign test
--------Null hypothesis: median = 10,0
Alternative: not equal
Number of values below hypothesized median: 24
Number of values above hypothesized median: 26
Large sample test statistic = 0,141421 (continuity correction applied)
P-Value = 0,887532
Do not reject the null hypothesis for alpha = 0,05.
signed rank test
---------------Null hypothesis: median = 10,0
Alternative: not equal
Average rank of values below hypothesized median: 23,375
Average rank of values above hypothesized median: 27,4615
Large sample test statistic = 0,733649 (continuity correction applied)
P-Value = 0,46316
Do not reject the null hypothesis for alpha = 0,05.
The StatAdvisor
--------------This pane displays the results of three tests concerning the center
of the population from which the sample of NORM+UNIF comes. The first
test is a t-test of the null hypothesis that the mean NORM+UNIF equals
10,0 versus the alternative hypothesis that the mean NORM+UNIF is not
equal to 10,0. Since the P-value for this test is greater than or
equal to 0,05, we cannot reject the null hypothesis at the 95,0%
confidence level. The second test is a sign test of the null
hypothesis that the median NORM+UNIF equals 10,0 versus the
alternative hypothesis that the median NORM+UNIF is not equal to 10,0.
It is based on counting the number of values above and below the
hypothesized median. Since the P-value for this test is greater than
or equal to 0,05, we cannot reject the null hypothesis at the 95,0%
confidence level. The third test is a signed rank test of the null
hypothesis that the median NORM+UNIF equals 10,0 versus the
alternative hypothesis that the median NORM+UNIF is not equal to 10,0.
It is based on comparing the average ranks of values above and below
the hypothesized median. Since the P-value for this test is greater
than or equal to 0,05, we cannot reject the null hypothesis at the
95,0% confidence level. The sign and signed rank tests are less
sensitive to the presence of outliers but are somewhat less powerful
than the t-test if the data all come from a single normal distribution.
Hypothesis Tests
Hypothesis Tests
---------------Sample standard deviation = 3,1735
Sample size = 50
95,0% upper confidence bound for sigma: [3,81367]
Null Hypothesis: standard deviation = 3,0
Alternative: less than
Computed chi-squared statistic = 54,8316
P-Value = 0,736951
Do not reject the null hypothesis for alpha = 0,05.
The StatAdvisor
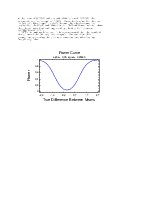
--------------This analysis shows the results of performing a hypothesis test
concerning the standard deviation (sigma) of a normal distribution.
The two hypotheses to be tested are:
Null hypothesis: sigma = 3,0
Alternative hypothesis: sigma < 3,0
Given a sample of 50 observations with a standard deviation of 3,1735,
the computed chi-square statistic equals 54,8316. Since the P-value
for the test is greater than or equal to 0,05, the null hypothesis
cannot be rejected at the 95,0% confidence level. The confidence
bound shows that the values of sigma supported by the data are less
Уважаемый посетитель!
Чтобы распечатать файл, скачайте его (в формате Word).
Ссылка на скачивание - внизу страницы.