n Lefts – changes the X coordinate of the upper left corner of each node to that of the master node.
n Centers – changes the X coordinate of the center of each node to that of the master node.
n Rights – changes the X coordinate of the upper right corner of each node to that of the master node.
n Tops – changes the Y coordinate of the top left corner of each node to that of the master node.
n Middles – changes the Y coordinate of the center of each node to that of the master node.
n Bottoms – changes the Y coordinate of the top right corner of each node to that of the master node.
|
|
Using the Align option can potentially cause your nodes to overlap. As a result, users might think that nodes have been deleted. Actually, the nodes still exist, they just overlap. If tasks still exist in another view, they should also exist in the Network Diagram view. |
Like summary tasks in other views, summary tasks in the Network Diagram are affected by the options found on the View tab under Tools/Options. Note that these settings are specific to each view. In other words, settings for one view do not affect other views. If you look at the View tab while in the Network Diagram view, you will notice that Indent Name and Show Outline Number are both grayed out. This is because these options are not available in the Network Diagram view.
|
|
Although most options on the View tab are not global throughout all views, the Project Summary Task option is global and will affect all views. |
Printing the Network Diagram is essentially the same as printing other views in Microsoft Project 2000. Regardless of the background color and pattern chosen for the view, Microsoft Project only prints the Network Diagram with a white background.
Legends for the Network Diagram are dependent on the settings made in the Box Styles dialog box. Note that although the names of the types of tasks cannot be changed and you cannot add custom types, any changes to the nodes are reflected in the printed legend.
One scenario that is fairly unique to Network Diagrams occurs when attempting to use the Fit to option located on the Page tab in the Page Setup dialog box (File menu/Page Setup). When this option is set, the Adjust For Page Breaks option (found in the Layout dialog box) is disabled. This may cause nodes to break across pages if attempting to fit to more than one page.
To work around this issue, set the option to fit to the desired pages to see the scaling units used. Then manually adjust the scaling units to this amount while making sure Adjust For Page Breaks is enabled. This may require that you adjust the scaling units to ensure only the desired amount of pages are used.
One powerful improvement in Microsoft Project 2000 is the ability to filter in the Network Diagram view. Filters can be applied in the Network Diagram view just as they can be in any other view. There are no special filters for Network Diagrams.
One of the powerful features that filtering allows is the ability to display a link chain of tasks. This can be done by holding down the Shift key and selecting the first task in the chain you want to display.
A link chain can be even more clearly displayed by splitting the screen so that the top pane displays the Network Diagram view and the bottom pane displays the Gantt chart view. Selecting the first chain task in the Network Diagram while holding down the Shift key will list all tasks in the link chain in the Gantt chart.
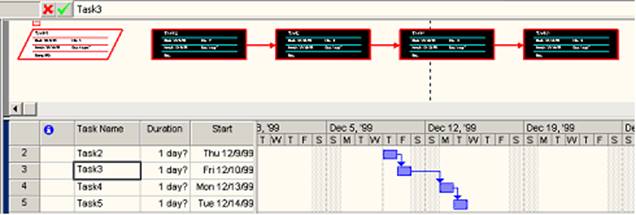 Figure 7 -
Task Chain
Figure 7 -
Task Chain
Because the Network Diagram is essentially a new feature set in Microsoft Project and not simply a new view, there has been extensive work done on the VBA Object Model. Below are some of these changes.
Уважаемый посетитель!
Чтобы распечатать файл, скачайте его (в формате Word).
Ссылка на скачивание - внизу страницы.