So far we’ve looked at formatting groups of nodes based on predefined types of tasks. Similar to the way Microsoft Project allows you to format Gantt Bar styles and Gantt Bars, Microsoft Project also allows you to format individual nodes. To do this, you must use the Format Box dialog box. To display the Format Box dialog box, on the Format menu, click Box:
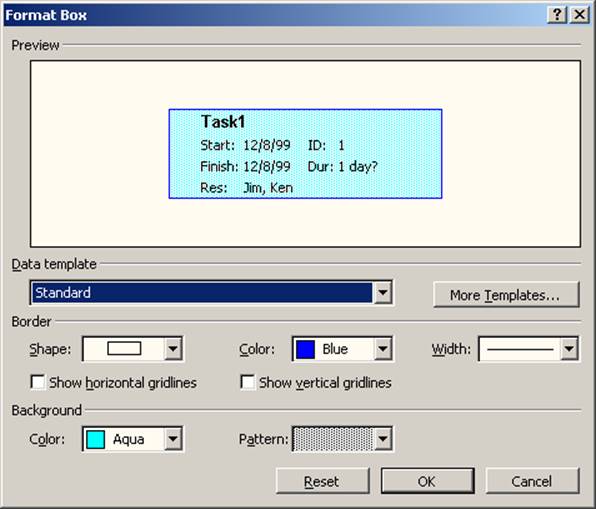
Figure 5 - Format Box Dialog
As you can see from the above figure, this dialog box is similar to the Box Styles dialog box. The only differences are that there are no options to select the type of task, set the highlight filter style, or select a task ID to display in the preview section. All other options work similarly to those found in the Box Styles dialog box.
Individual node formats can be removed by clicking the Reset button. This causes the node to be formatted in the default style for the task type.
One large improvement in Microsoft Project 2000 is the control that users have over the layout of a project’s nodes. An entire new dialog box has been created with all available layout options. To display this dialog box, go to the Format menu and click Layout.
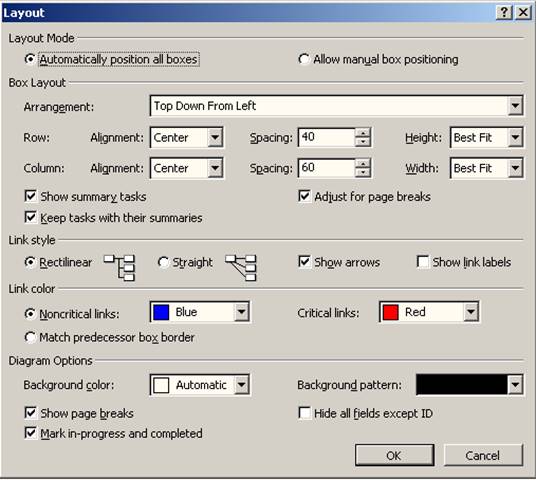
Figure 6 - Layout Dialog
As you can see from the above figure, the first option of the Layout dialog box, Layout Mode, allows you to choose between automatic and manual positioning. Automatic positioning positions nodes at all times and does not allow you to manually customize a node’s position. Manual positioning allows you to position nodes as you want. When manual positioning is selected, Microsoft Project never moves nodes.
The next section of the Layout dialog box is the Box Layout section. Here you can choose from seven node layout schemes. The available schemes are as follows:
1. Top Down From Left – this is the default layout scheme, which starts laying out nodes from the upper left corner.
2. Top Down by Day – this scheme lays out nodes starting from the upper left corner, but groups tasks starting on the same day within the same column.
3. Top Down by Week – this scheme lays out nodes starting from the upper left corner, but groups tasks starting in the same week within the same column.
4. Top Down by Month – this scheme lays out nodes starting from the upper left corner, but groups tasks starting in the same month within the same column.
5. Top Down – Critical First – this scheme lays out nodes from the upper left corner, but lists critical nodes first, then lists all other nodes.
6. Centered From Left – this scheme lays out nodes from the center left, and expands evenly up and down while flowing to the right.
7. Centered From Top – this scheme lays out nodes from top to bottom, expanding evenly to both the right and to the left while flowing down.
The other options found in the Box Layout section of the dialog box deal with node layout within the virtual grid which overlays the Network Diagram. The virtual grid can be thought of as a set of rows and columns that covers the entire Network Diagram. Rows and columns overlap in virtual cells. A virtual cell can generally be thought of as the space in which one node resides, although more than one node can exist in a virtual cell. Microsoft Project allows you to control the alignment of nodes within the virtual cell, the spacing between the cells, and the size of the cells.
To control the alignment of nodes within virtual cells, Microsoft Project uses the following two options:
n Row Alignment – This option affects the vertical alignment of the node within the virtual cell. Available options are Top, Center, and Bottom.
n Column Alignment – This option affects the horizontal alignment of the node within the virtual cell. Available options are Left, Center, and Right.
To control the spacing between virtual cells (or more accurately the white space between rows and columns) Microsoft Project uses the following two options:
Уважаемый посетитель!
Чтобы распечатать файл, скачайте его (в формате Word).
Ссылка на скачивание - внизу страницы.