|
|||||||||||
Module 3.1 |
PSS Learning Services
|
Lesson 1: The Network Diagram View 1 |
Information in this document is subject to change without notice. The names of companies, products, people, characters, and/or data mentioned herein are fictitious and are in no way intended to represent any real individual, company, product, or event, unless otherwise noted. Complying with all applicable copyright laws is the responsibility of the user. No part of this document may be reproduced or transmitted in any form or by any means, electronic or mechanical, for any purpose, without the express written permission of Microsoft Corporation. If, however, your only means of access is electronic, permission to print one copy is hereby granted.
Microsoft may have patents, patent applications, trademarks, copyrights, or other intellectual property rights covering subject matter in this document. Except as expressly provided in any written license agreement from Microsoft, the furnishing of this document does not give you any license to these patents, trademarks, copyrights, or other intellectual property.
© 2000 Microsoft Corporation. All rights reserved.
Microsoft, Active Accessibility, ActiveX, FrontPage, MS-DOS, Outlook, PhotoDraw, PowerPoint, SQL Server, Visual Basic, Visual C++, Visual J++, Windows, and Windows are either registered trademarks or trademarks of Microsoft Corporation in the United States and/or other countries/regions.
The names of actual companies and products mentioned herein may be the trademarks of their respective owners.
Microsoft® Project 2000 offers new tools to view your project information the way you want. These include the Network Diagram, Custom Fields and Grouping. In this lesson we will discuss the first of those tools, the Network Diagram (formerly known as the PERT Chart.)
After completing this lesson, you will be able to:
n Describe features of the Network Diagram
n Use formatting features of the Network Diagram
n Describe limitations of Network Diagram and potential workarounds
n List new views and tables and describe their uses
Of all the new ways to view your information, the Network Diagram is arguably the biggest change. Formerly known as the PERT Chart, the Network Diagram offers a new way for Microsoft Project users to view their projects.
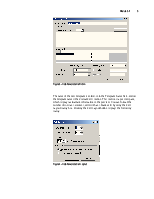
As in the Gantt Chart, you can use the Box Style dialog box to format types of tasks in the Network Diagram. To bring up the Box Styles dialog box, go to the Format menu and click Box Styles.
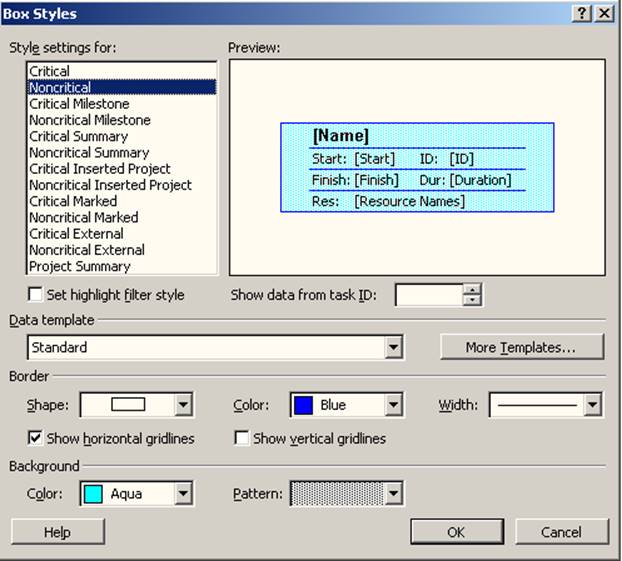
Figure 1 - Box Styles
In the Style Settings For section of the dialog box, you can select the type of task that you would like to format. If you select multiple types of tasks, you can simultaneously change attributes of all the types of tasks you have selected. The Preview section displays how the node will look with the currently selected settings. If multiple types of tasks are selected, the preview will be blank.
Directly below are the options Set highlight filter style and Show data from task ID. The Set highlight filter style option allows you to preview the highlight filter style for that particular task type. It also changes the options below it to those of the highlight filter style and allows you to customize the style by changing those options.
When entering the task ID, the “Show data from Task ID” option allows you to view that task’s information with the currently selected formatting options.
In the Data template drop down list box you can select the data template on which the selected task type is based. Data templates setup up pre-defined groups of fields to be displayed inside nodes. Data templates will be discussed in more detail latter on in this lesson.
This dialog box also contains options for formatting borders and backgrounds for the nodes. There are also toggles for displaying vertical and horizontal gridlines within a node.
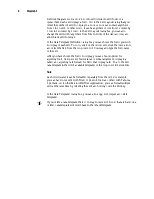
Data templates allow you to set up predefined groups of fields to display in your Network Diagram nodes. You can both import or create data templates in the Data Templates dialog box. To access the Data Templates dialog box, click the More Templates button in the Box Styles dialog box.
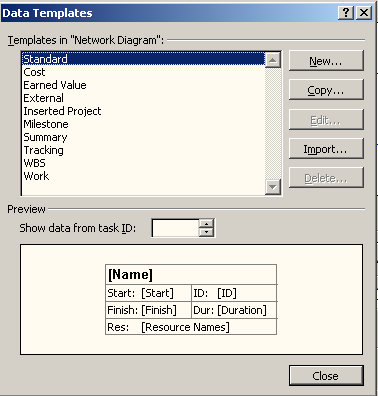
Figure 2 - Data Templates
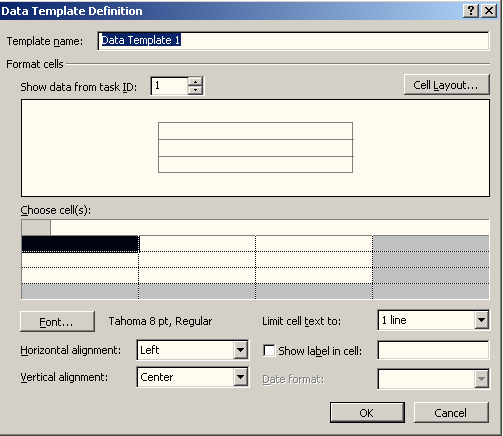
To create a new data template, click the New button in the Data Templates dialog box to display the Data Template Definition dialog box.
Уважаемый посетитель!
Чтобы распечатать файл, скачайте его (в формате Word).
Ссылка на скачивание - внизу страницы.