Rossion and Pourtois (2004) collected normative data for Snodgrass and Vanderwart’s object database of 260 B and W line-drawings (Snodgrass & Vanderwart, 1980). They then compared these data to data collected using the same shapes with gray-level texture and color added. Whereas, the addition of texture and shading without color yielded a slight improvement in terms of naming agreement scores, the addition of color information unambiguously improved the naming accuracy and speeded correct response times. This was observed for fruits, vegetables as well as man-made objects, with and without a single diagnostic (prototypical) color (Rossion & Pourtois, 2004).
Given our previous results on object naming performance in literate and illiterate subjects as well as the recent interest in the role of color in object recognition and naming, the primary objective of the present experiment was to investigate whether color information can be used synergistically to access stored object knowledge and benefit illiterate more than literate subjects. Specifically, we aimed to investigate whether there are differences in edge-based and color-based information processing of two-dimensional visual objects between illiterate subjects and literate controls. To this end, we investigated their immediate object naming performance on line-drawings and photos, presented either in color or in black-and-white (i.e., grey-scaled) in a fully randomized study design. Based on our previous results that demonstrated that the illiterate population has problems with decoding 2D representations compared to 3D representations (Reis et al., 2001), we predicted that illiterate subjects would benefit most from the additional surface-based information provided by the color compared black-and-white stimuli as well as by the photos compared to the drawings.
In this study, we investigated the literate and illiterate population of Olhão in southern Portugal that we have been following for a number of years and where some subjects are illiterate for well-defined socio-cultural reasons [for a general overview of the selection procedures, see e.g., (Petersson and Reis, 2005, Petersson et al., 2001 and Reis et al., 2003)]. Briefly, in order to minimize the interference of other cultural factors, the illiterate subjects and their matched literate controls were selected from a similar socio-cultural background in a relatively homogeneous fishermen community of southern Portugal, where most of the subjects have lived most of their lives. The illiterate group consisted of 19 illiterate female subjects aged 61–75 (mean ± SD: 68 ± 4). The literate group included 19 literate females aged 56–83 (66 ± 8) and with a mean literacy level of 4.0 ± 0 years of education. The mean age difference was not significant. All participants had normal or corrected to normal vision and any kind of colour vision defects were excluded by the naming task of the neuropsychological test-battery used in the selection procedure, which included naming of colored objects (yellow, red, and green).
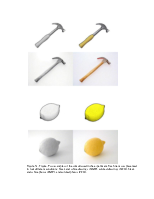
The full set of items included 70 object representations (Supplementary Table), each well matched to a common everyday real object, selected from the set of Snodgrass and Vanderwart (1980). We chose common everyday objects for two reasons: to minimize possible vocabulary differences between subjects and the ease with which the drawings could be matched to similar real object to generate the photos. The real objects were chosen to be as similar as possible, both in terms of size and shape, to the line-drawings. A digital camera Fuji Finepix 601 with a 6-megapixel resolution was used to photograph each object in a colored version. Object orientation and size were matched to the line-drawing. The black and white version was derived from the colored one by applying Adobe Photoshop 7.0 “gray scale mode” command. All the 70 items were classified according to familiarity, visual ambiguity, and age of acquisition based on norms for the Snodgrass and Vanderwart set for the Portuguese population (Ventura, 2003). Visual complexity values were used from the original work from Snodgrass and Vanderwart (1980) (cf., Supplementary Table). Five different versions of each stimulus were generated: line drawings just constituted by the contours, black-and-white drawings (i.e., grey-scaled; DBW), color drawings (DCO), black-and-white photos (PBW) and color photos (PCO). Data collected using the line-drawing stimuli (contours) were not considered in the statistical analysis. The DBW (grey-scaled) and DCO representations were selected from the set generated by Rossion and Pourtois (2004) and correspond to the original Snodgrass and Vanderwart’s set and are available online. Each stimulus for the DBW, DCO, PBW, and PCO conditions were presented in a 760 × 550 pixel format (cf., Supplementary Figure). The Presentation Software (http://nbs.neuro-bs.com/presentation) was used to display the stimuli on a HP laptop computer screen (size: 15”; spatial resolution: 1024*768 as the limiting resolution; color resolution: 24 bits) and to register responses as well as reaction times (RTs). Each stimulus was displayed for 5 s and voice detection equipment registered the RT between the on-set of the display and the on-set of the response. The 5 s display time was sufficient to name the items in each condition (Goodglass et al., 1984, Levelt et al., 1998 and Salmelin et al., 1994). All verbal responses were recorded with a tape-recorder. The 70 items were divided into 5 sets of 14 items each. For each participant five different sets of items were randomly chosen without replacement to be presented in one of the conditions. No subject saw the same object twice, to avoid the same object
Уважаемый посетитель!
Чтобы распечатать файл, скачайте его (в формате Word).
Ссылка на скачивание - внизу страницы.