In this chapter experimental methods of skiving variable measurement have been represented. The orthogonal skiving process has been accomplished at vertical milling CNC machine. The 2.5 mm girdles turned from thick-walled tube workpiece 70 mm in diameter have been skived. The transient cutting forces both in cutting direction and in feeding direction have been measured at the toolholder with a 3-axial dynamometer UDM-1200 and recorded with high-speed multi-pen recorder N338. Thermocouple outputs and real UCT variation has been also recorded. All experimental equipment has been under control of specially designed device, which provides both strong record synchronization with revolution of milling machine spindle and accurate detection of tool engage and exit phase.
In order to measure a cutting length ratio a hole method has been used. It intends a chip length measurement between two adjacent holes, which are results of previously drilled holes in the machining surface. An average chip length ratio at the middle of the certain revolution can be obtained by dividing cutting length at this revolution by measured chip length. The chip length variation can be calculated by interpolation.
The cutting conditions have been set within the following ranges: cutting speed of 90-350 m/min that corresponds to 400-2000 rev/min of spindle speed; feed of 0.5-1.5 mm/rev; removing allowance of 0.5-1.5 mm.
Special methods have been occupied for measurement results processing. It has been noted that these methods take into account all features of the test equipment design including phase shift among sensor outputs, test system deformation etc. Mathcad 7.0 for Windows 95 software has been occurred to make calculation more convenient and faster.
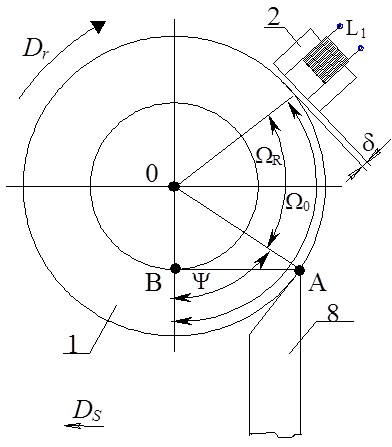
The real UCT variation is a topic of a special interest from the skiving point of view. That is why the method and experimental equipment have been developed and represented in the first section ”Undeformed Chip Thickness Variation Measurement”. According to the main idea, UCT variation can be computed from air-gap between contactless variable-induction pick-up and machined surface variation that can easily be measured and recorded.
A detail description of the equipment has been given. It involves a variable-induction pick-up, a measuring bridge, a controllable amplifier unit, a sinusoidal pulse generator unit, and a power unit. N338 recorder can register the pick-up outputs as given in the figure 6.
The theoretical basis of this approach has been given and described in detail. It has been shown that the pick-up has maximum sensitivity at about 0.5mm air gap and has to set-up to linear response. It has been also pointed up that the pick-up working frequency can be chosen within the range of 2-10 kHz depending on the working material. Therefore, the pick-up has been designed as 500 coils inductor wound onto ferrite E-core. In order to avoid an influence of external electromagnetic fields it has been placed into plastic thick-walled frame and fixed on heavy apparatus with setting-up and fixing possibilities.
|
1 - Workpiece; 2 – Inductive pick-up; 3 – measuring bridge; 4 – controllable amplifier unit; 5 – Recorder; 6 – Sinusoidal pulse generator unit; 7 – Power unit; 8 - Tool Figure 6- UCT measurement equipment scheme |
According to tests, the pick-up has a linear response only under 0.5mm air-gap variation. Therefore, pick-up calibration is required. The setting-up and calibration routine has been described in detail. It has been shown that initial measuring bridge unbalancing is necessary for stable results acquiring.
Threshold sensitivity has been also measured and was about 3 mm. That is why shape deviation of machined surface can readily be measured directly at the milling machine on the assumption that spindle radial run-out is less than or equal to 3 mm. Unfortunately, the working sensitivity is usually less than the threshold one and depends on the recorder measuring range. A deep analysis of method’s accuracy and sensitivity has been given. All other features of real UCT variation measurement have been described by giving on example.
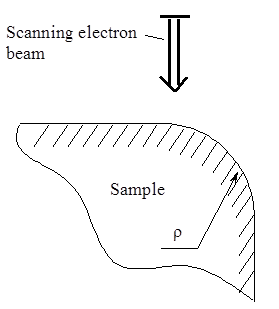
According to general FE simulation concept proposed in the study, the real tool edge radius value is strongly needed. As it has been determined, there are no convenient, accuracy and evident methods of tool edge radius measurement. In the second section “Tool Edge Radius Measurement” an evident and a high accuracy method has been represented. It bases on scanning electron microscope utilization. It is well known that visual contrast of two close points which is obtained at the secondary emission mode of SEM strongly depends on scanning surface curvature angle. This phenomenon leads to image brightness increasing with increasing of tool edge surface angle. According to the tests, the boundaries of curvature are usually well-defined and therefore tool-edge radius can be accurately measured from obtained snapshot as it follows from figure 7. Another benefit of the proposed method is that it readily allows checking of the tool edge along the whole edge width. According to the measurement been performed tool edge radius is not constant along the edge width and there is a great variety of different defects.
|
Figure 7 – The principle of tool edge radius measurement |
In this study, REM-100 has been involved. The filming conditions have been chosen as follows: magnification 1000´; duration of 500-line frame - 40 ms. In order to make snapshot quality higher and curvature boundaries more precise a special method for the obtained snapshot processing based on computer utilization has been developed. PhotoShop 3.0 for Windows 95 has been engaged.
Уважаемый посетитель!
Чтобы распечатать файл, скачайте его (в формате Word).
Ссылка на скачивание - внизу страницы.
 а)
а)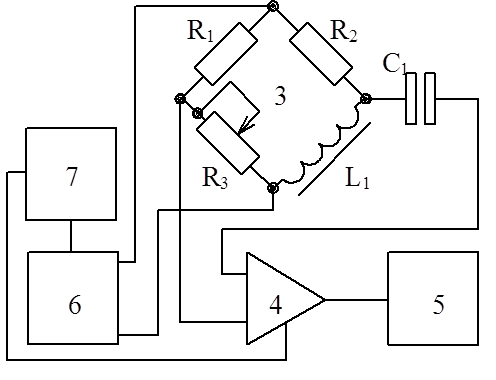 б)
б)