Галушкин И. В. Е-441
Прикладная статистика.
Лабораторная работа № 8.
Однофакторный ранговый и дисперсионный анализ в статистическом пакете STATGRAPHICS.
Вариант № 2:
|
Стаж |
Возраст |
||
|
от 25 до35 лет |
от 35 до 45 лет |
от 45 до 55 лет |
|
|
от 1 до 4 лет |
19,20,20,20,22, |
19,20,20,23,25, |
18,19,20,21,23, |
|
от 4 до 7 лет |
30,31,32,32,34, |
20,29,30,31,31, |
19,25,25,26,26, |
|
от 7 до 10 лет |
35,35,39,40,41, |
36,40,41,42,45, |
24,24,24,25,25, |
|
свыше 10 лет |
40,40,41,41,42 |
28,31,35,36,40, |
20,24,25,31,32, |
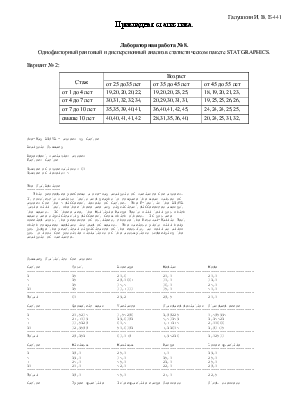
One-Way ANOVA - abserv by factor
Analysis Summary
Dependent variable: abserv
Factor: factor
Number of observations: 60
Number of levels: 4
The StatAdvisor
--------------This procedure performs a one-way analysis of variance for abserv.
It constructs various tests and graphs to compare the mean values of
abserv for the 4 different levels of factor. The F-test in the ANOVA
table will test whether there are any significant differences amongst
the means. If there are, the Multiple Range Tests will tell you which
means are significantly different from which others. If you are
worried about the presence of outliers, choose the Kruskal-Wallis Test
which compares medians instead of means. The various plots will help
you judge the practical significance of the results, as well as allow
you to look for possible violations of the assumptions underlying the
analysis of variance.
Summary Statistics for abserv
factor Count Average Median Mode
---------------------------------------------------------------------------------------------------1 15 20,6 20,0 20,0
4 15 28,0667 30,0 31,0
7 15 34,4 36,0 24,0
10 15 33,7333 35,0 40,0
---------------------------------------------------------------------------------------------------Total 60 29,2 28,5 20,0
factor Geometric mean Variance Standard deviation Standard error
---------------------------------------------------------------------------------------------------1 20,5234 3,54286 1,88225 0,485994
4 27,7039 19,6381 4,43149 1,14421
7 33,5128 60,4 7,77174 2,00666
10 32,9588 50,6381 7,11604 1,83735
---------------------------------------------------------------------------------------------------Total 28,151 63,078 7,94216 1,02533
factor Minimum Maximum Range Lower quartile
---------------------------------------------------------------------------------------------------1 18,0 25,0 7,0 19,0
4 19,0 34,0 15,0 25,0
7 24,0 45,0 21,0 25,0
10 20,0 42,0 22,0 28,0
---------------------------------------------------------------------------------------------------Total 18,0 45,0 27,0 22,5
factor Upper quartile Interquartile range Skewness Stnd. skewness
---------------------------------------------------------------------------------------------------1 22,0 3,0 1,0441 1,65087
4 31,0 6,0 -0,875062 -1,38359
Уважаемый посетитель!
Чтобы распечатать файл, скачайте его (в формате Word).
Ссылка на скачивание - внизу страницы.