
Figure 1. Number of participants who completed tasks on both desktop and mobile browser
5.3 Task Completion Time
From the total time participants spent completing four tasks on both desktop and mobile browser, 80% of the time was spent on performing tasks on mobile browser and only 20% on desktop browser. The average time participants spent on performing each task on desktop was 1.41 minutes and 5.7 minutes on mobile browser. The average task completion time for all the tasks on desktop browser for all the participants was under 6 minutes, and for mobile browser it was around 23 minutes.
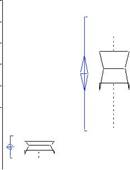
Box and whisker chart (see Figure 2 and 3) show the spread of the data. It represents summary statistics for the analysis variable time. Parametric and non-parametric summary statistics arepresented for each variable, to indicate the central tendency and the scatter/dispersion of the observations.
The blue notched lines show the requested parametric percentile range, where the blue diamond shows the mean and the requested confidence interval around the mean. The notched box and whiskers show non-parametric statistics. It shows the quartiles of the data, using these as an indication of the spread. Boxes cover interquartile ranges (IQR), whiskers extend to the normal limits of distributions, the line bisecting the box is the median, and the notches in the sides of boxes indicate 95 per cent confidence limits for the median.
Each of the box-and-whisker plots (see Figure 2) describes the total time each participant took for all task on desktop and mobile browser. In the figure below, the medians for desktop browser and mobile browser box plots are significantly different at approximately the 0.05 level as the corresponding notches do not overlap.
![]()
![]()
![]()
![]()
Task completion time
|
40 |
||
|
35 |
||
|
30 |
||
|
(mins) |
25 |
|
|
20 |
||
|
Time |
15 |
|
10
![]()
5
![]()
0
![]()
![]()
![]()
![]()
![]()
Desktop Mobile
Figure 2. Box and whisker chart of total task completion time on both desktop and mobile browser
5.4 Task Rating
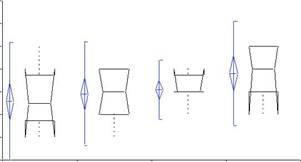
Participants rated each task that they performed on mobile browser for the level of difficulty, where 1 = Very Easy; 2= Easy; 3 = OK; 4 = Hard; 5 = Very Hard. The lower the score, the more positively the participant rated the task. Figure 3 shows box and whisker chart of overall ratings for all the tasks. Task 1 has a lowest rating of 2.6 and task 4 has a highest rating of 3.8.
![]()
![]()
![]()
![]()
|
hard) |
7 |
Overall task ratings for all the tasks performed on mobile browser |
||||
|
6 |
||||||
|
5=Very |
5 |
|||||
|
easy; |
4 |
|||||
|
(1=Very |
3 |
|||||
|
2 |
||||||
|
Ratings |
1 |
|||||
|
0 |
||||||
|
Task 1 |
Task 2 |
Task 3 |
Task 4 |
|||
|
Tasks |
||||||
![]()
![]()
![]()
![]()
![]()
Уважаемый посетитель!
Чтобы распечатать файл, скачайте его (в формате Word).
Ссылка на скачивание - внизу страницы.