Hypothesis Tests
Hypothesis Tests
---------------Sample standard deviations = 2,63268 and 3,51617
Sample sizes = 50 and 100
95,0% confidence interval for ratio of variances: [0,350951;0,932736]
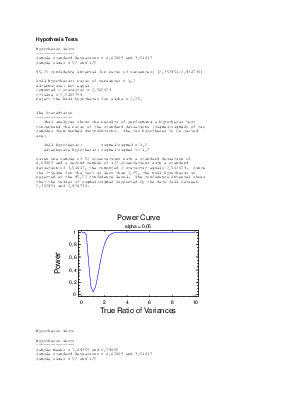
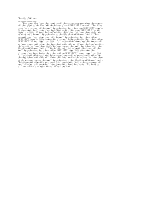
Null Hypothesis: ratio of variances = 1,0
Alternative: not equal
Computed F statistic = 0,560604
P-Value = 0,0263784
Reject the null hypothesis for alpha = 0,05.
The StatAdvisor
--------------This analysis shows the results of performing a hypothesis test
concerning the ratio of the standard deviations (sigma1/sigma2) of two
samples from normal distributions. The two hypotheses to be tested
are:
Null hypothesis: sigma1/sigma2 = 1,0
Alternative hypothesis: sigma1/sigma2 <> 1,0
Given one sample of 50 observations with a standard deviation of
2,63268 and a second sample of 100 observations with a standard
deviation of 3,51617, the computed F statistic equals 0,560604. Since
the P-value for the test is less than 0,05, the null hypothesis is
rejected at the 95,0% confidence level. The confidence interval shows
that the values of sigma1/sigma2 supported by the data fall between
0,350951 and 0,932736.
Hypothesis Tests
Hypothesis Tests
---------------Sample means = 7,29358 and 6,79665
Sample standard deviations = 2,63268 and 3,51617
Sample sizes = 50 and 100
Approximate 95,0% confidence interval for difference between means: 0,49693 +/- 1,01346 [-0,516531;1,51039]
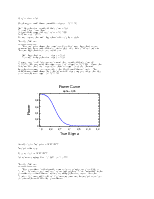
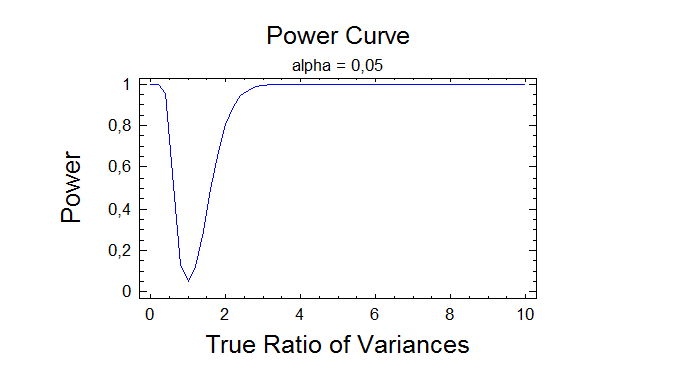
Null Hypothesis: difference between means = 0,0
Alternative: not equal
Computed t statistic = 0,970362
P-Value = 0,333728
Do not reject the null hypothesis for alpha = 0,05.
(Equal variances not assumed).
The StatAdvisor
--------------This analysis shows the results of performing a hypothesis test
concerning the difference between the means (mu1-mu2) of two samples
from normal distributions. The two hypotheses to be tested are:
Null hypothesis: mu1-mu2 = 0,0
Alternative hypothesis: mu1-mu2 <> 0,0
Given one sample of 50 observations with a mean of 7,29358 and a
standard deviation of 2,63268 and a second sample of 100 observations
with a mean of 6,79665 and a standard deviation of 3,51617, the
computed t statistic equals 0,970362. Since the P-value for the test
is greater than or equal to 0,05, the null hypothesis cannot be
rejected at the 95,0% confidence level. The confidence interval shows
that the values of mu1-mu2 supported by the data fall between
-0,516531 and 1,51039.
NOTE: in running this test, it has not been assumed that the
standard deviations of the two samples are equal. You can make that
assumption by pressing the alternate mouse button and selecting
Analysis Options.
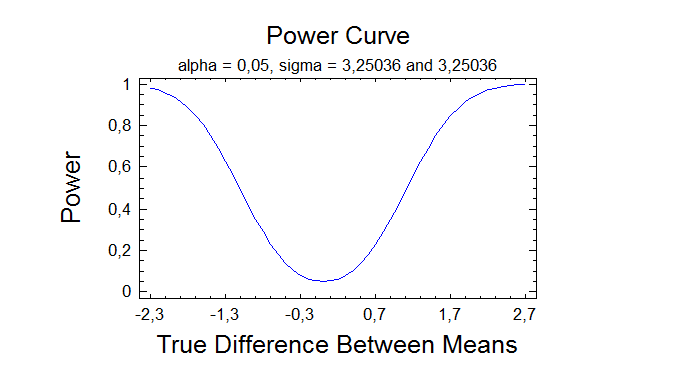
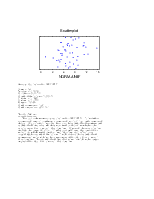
Multiple-Variable Analysis
Analysis Summary
Data variables:
NORM
NORM1
All available data will be used in each calculation.
The StatAdvisor
--------------This procedure is designed to summarize several columns of
quantitative data. It will calculate various statistics, including
correlations, covariances, and partial correlations. Also included in
the procedure are a number of multivariate graphs, which give
interesting views into the data. Use the Tabular Options and
Graphical Options buttons on the analysis toolbar to access these
different procedures.
After this procedure, you may wish to select another procedure to
build a statistical model for your data. Depending on your goal, one
of several procedures may be appropriate. Following is a list of
goals with an indication of which procedure would be appropriate:
GOAL: build a model for predicting one variable given values of one of
more other variables.
PROCEDURE: Relate - Multiple regression
GOAL: group rows of data with similar characteristics.
PROCEDURE: Special - Multivariate Methods - Cluster Analysis
GOAL: develop a method for predicting which of several groups new rows
belong to.
PROCEDURE: Special - Multivariate Methods - Discriminant Analysis
GOAL: reduce the number of columns to a small set of meaningful
measures.
PROCEDURE: Special - Multivariate Methods - Factor Analysis
GOAL: determine which combinations of the columns determine most of
the variability in your data.
PROCEDURE: Special - Multivariate Methods - Principal Components
GOAL: find combinations of the columns which are strongly related to
each other.
PROCEDURE: Special - Multivariate Methods - Canonical Correlations
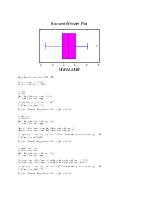
Summary Statistics
NORM NORM1
---------------------------------------------------------------------------------------------------Count 50 100
Average 7,29358 6,79665
Variance 6,93102 12,3423
Standard deviation 2,63268 3,51317
Minimum 0,906411 -0,662894
Maximum 14,551 17,3009
Range 13,6446 17,9638
Stnd. skewness 1,04745 1,25159
Stnd. kurtosis 0,502824 0,0149142
---------------------------------------------------------------------------------------------------The StatAdvisor
--------------This table shows summary statistics for each of the selected data
Уважаемый посетитель!
Чтобы распечатать файл, скачайте его (в формате Word).
Ссылка на скачивание - внизу страницы.