Laboratory work №1
Determining the audibility’s threshold (threshold of hearing)
Purpose of the work: To determine the audibility’s threshold (threshold of hearing) for different audio frequencies.
1.1. Getting the audiogram by using generator of low-frequency signals (РГЗ-124).
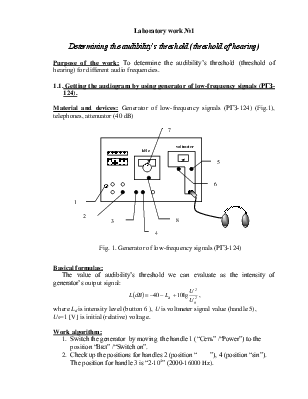
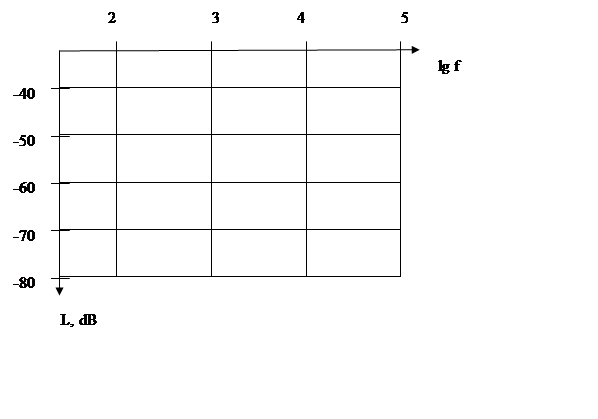
Material and devices: Generator of low-frequency signals (РГЗ-124) (Fig.1), telephones, attenuator (40 dB)
Basical formulas:
The value of audibility’s threshold we can evaluate as the intensity of generator’s output signal:
 ,
,
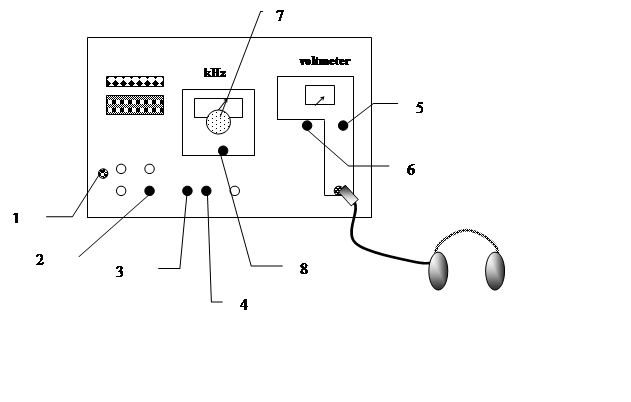
where Ld is intensity level (button 6 ), U is voltmeter signal value (handle 5),
U0=1 [V] is initial (relative) voltage.
1. Switch the generator by moving the handle 1 (“Сеть” /“Power”) to the position “Вкл” /“Switch on”.
2. Check up the positions for handles 2 (position “ ”), 4 (position “sin”). The position for handle 3 is “2×10⁴” (2000-16000 Hz).
3. Set the value of frequency (f=0.200 kHz). By using the handle 7 you can set it approximately, by using the handle 8 you can set it exactly.
4. Put on the headphones.
5. Set the value of voltage (U0=1 V) by using the handle 5. The position for the handle 6 is 60 dB.
6. By using the handle 6 decrease the signal's value on 10 dB each time until the fade of sound. This value (the value of intensity decrease) you must write into the table as Ld.
7. Increase voltage's value by handle 5 until you’ll achieve sound's audibility. This voltage value you must write into the table as U.
8. Start again from step 5 for frequencies 0.4; 0.8; 1.2; 1.6; 2.0; 4.0; 6.0; 8.0; 10.0; 12.0; 14.0 kHz (for switching of frequencies diapasons use the handle 3).
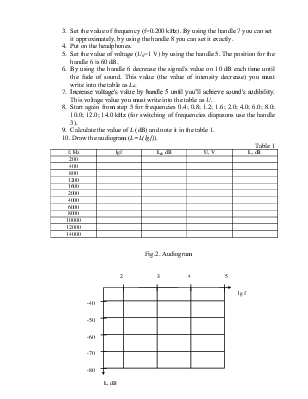
9. Calculate the value of L (dB) and note it in the table 1.
10. Draw the audiogram (L=L(lgf)).
|
f, Hz |
lgf |
Ld, dB |
U, V |
L, dB |
|
200 |
||||
|
400 |
||||
|
800 |
||||
|
1200 |
||||
|
1600 |
||||
|
2000 |
||||
|
4000 |
||||
|
6000 |
||||
|
8000 |
||||
|
10000 |
||||
|
12000 |
||||
|
14000 |
 |
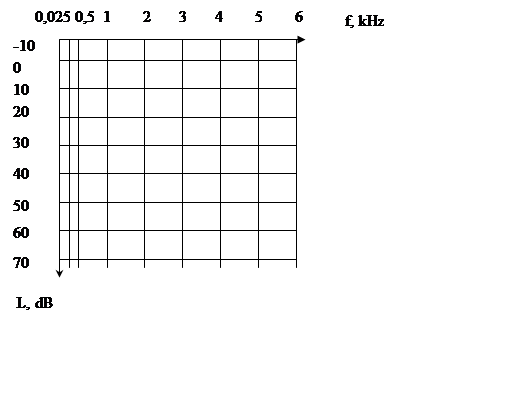
1.2. Audiogram getting using audiometer (УДК) (Fig.3).

1. Put on the headphones (You must pay attention to marks of left “L” and right “R” ear).
2. Set the frequency by using the handle 5.
3. Press and hold up the button 3 for left headphone or the button 4 for right headphone.
4. By using the handle 6 find the value of intensity level corresponding to sound's audibility.
5. Write the values of frequencies and the level of intensity for left and right ear in the table 2.
6. Draw the audiogram for left and right ears.
Table 2.
|
f, kHz |
Lleft, dB |
Lright, dB |
|
0,025 |
||
|
0,5 |
||
|
1 |
||
|
2 |
||
|
4 |
||
|
6 |
Уважаемый посетитель!
Чтобы распечатать файл, скачайте его (в формате Word).
Ссылка на скачивание - внизу страницы.