when the experts population become very homogeneous or by attaining a maximum number of generations.
The data. Our test deals with the French market; in particular, stocks belonging to the main index of the Paris Stock Exchange, namely the CAC40 index. We consider 24 stocks among the 40 composing the index on the period beginning on 1=2=1997 and ending on 11=10=1999 (interval ½0;TÞ: Each file contains the opening, closing, highest and lowest prices, and trading volumes.** The closing value of the index is also used by some rules.
We performed ten tests on each stock; to avoid the bias generated by the choice of the period, ten random beginning dates were selected; the learning period was 261 days long and the test period 7 days long.
Table I contains the beginning dates for the learning and the test periods. Each test period starts at the opening of the market at the given date and ends at the closing price (at which positions are liquidated).
The performance study is realized in two steps: first, we perform a global analysis across stocks and periods and we then compare the performances against two buy-and-hold (referred to as BH) strategies. In fact, we start with 100000 FRF and 100 stocks. The first BH strategy (numbered I) consists of keeping the 100 stocks and the cash, without moving, up to the terminal date. This portfolio exhibits a low risk level due to the important amount of cash. The alternative assumes that all the cash is initially invested in the stock with no trade after the initial date (strategy numbered II). Table II gives, in the second and third columns, the number of stocks for which the genetic algorithm performs better than the BH strategies on the test period. The fourth and fifth columns indicate the mean excess returns of the genetic strategy over the BH strategies. To see if the gap between the two strategies depends on the evolution of the market, the last columns report the evolution of the french CAC40 index. The correlation between the excess return of the genetic strategy and the BH1 return is about 0.91. It means that the genetic strategy performs better in a bull market. However, this conclusion needs to be interpreted cautiously because of the composition of the initial portfolio which contains 100000FRF and 100 stocks. In the BH1 strategy we have considered the return on this portfolio; consequently, the volatility across periods is low, due to the risk-free component. The
![]()
**The data were selected from the Thomson Financial-Datastream database.
Table II. Comparison of two strategies.
|
Experiment |
Number of gains (I) |
Number of gains (II) |
% Excess return (I) |
% Excess return (II) |
CAC40 (in %) |
|
1 |
23 |
18 |
3.6 |
1.46 |
3.22 |
|
2 |
20 |
15 |
1.96 |
0.92 |
2.47 |
|
3 |
23 |
21 |
2.06 |
2.6 |
2.8 |
|
4 |
17 |
22 |
0.62 |
3.25 |
1.56 |
|
5 |
24 |
16 |
2.43 |
1.32 |
0.13 |
|
6 |
16 |
17 |
0.4 |
1.08 |
4.9 |
|
7 |
13 |
8 |
0.17 |
0.87 |
1.1 |
|
8 |
18 |
16 |
1.18 |
1.14 |
4.96 |
|
9 |
22 |
18 |
2.16 |
3.93 |
0.03 |
|
10 |
22 |
15 |
3.9 |
0.03 |
3.08 |
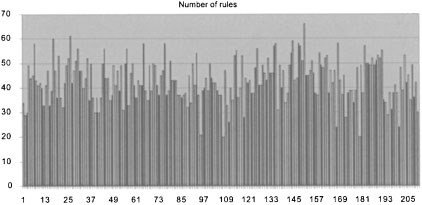
Figure 2. Percentage of time rules are used.
Уважаемый посетитель!
Чтобы распечатать файл, скачайте его (в формате Word).
Ссылка на скачивание - внизу страницы.