How to do polygons - Как делать многоугольники
|
|
|
|
|
|
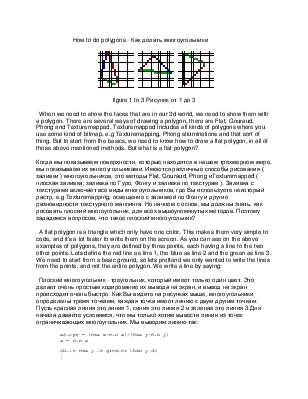
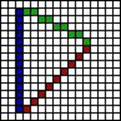
figure 1 to 3 Рисунок от 1 до 3
When we need to show the faces that are in our 3d world, we need to show them with a polygon. There are several ways of drawing a polygon, there are Flat, Gouraud, Phong and Texturemapped. Texturemapped includes all kinds of polygons where you use some kind of bitmap, e.g Texturemapping, Phong elluminations and that sort of thing. But to start from the basics, we need to know how to draw a flat polygon, in all of those above mentioned methods. But what is a flat polygon?
Когда мы показываем поверхности, которые находятся в нашем трехмерном мире, мы показываем их многоугольниками. Имеются различные способы рисования ( заливки ) многоугольников, это методы Flat, Gouraud, Phong иTexturemapped ( плоская заливка, заливка по Гуро, Фонгу и заливка по текстурам ). Заливка с текстурами включает все виды многоугольников, где Вы используете некоторый растр, e.g Texturemapping, освещение с заливкой по Фонгу и другие разновидности текстурного маппинга. Но начнем с основ, мы должны знать, как рисовать плоский многоугольник, для всех вышеупомянутых методов. Поэтому зададимся вопросом, что такое плоский многоугольник?
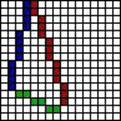
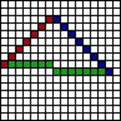
A flat polygon is a triangle which only have one color. This makes them very simple to code, and it's a lot faster to write them on the screen. As you can see on the above examples of polygons, they are defined by three points, each having a line to the two other points. Lets define the red line as line 1, the blue as line 2 and the green as line 3. We need to start from a basic ground, so lets prettend we only wanted to write the lines from the points, and not the entire polygon. We write a line by saying:
Плоский многоугольник - треугольник, который имеет только один цвет. Это делает очень простым кодирование их вывода на экран, и вывод на экран происходит очень быстро. Как Вы видите на рисунках выше, многоугольники определены тремя точками, каждая точка имеет линию к двум другим точкам. Пусть красная линия это линия 1, синия это линия 2 и зеленая это линия 3.Для начала давайте условимся, что мы только хотим вывести линии из точек ограничивающих многоугольник. Мы выводим линию так:
xslope = (max_x-min_x)/(max_y-min_y)
x = min_x
while max_y is greater than y do
{
x = x + xslope
y = y + 1
putpixel(x y color)
}
Or said in watcom C:
Или на watcom C:
void drawline(int x1, int y1, int x2, int y2, char color)
{
int side = 0;
float temp = x1;
float xslope = (x2-x1)/(y2-y1);
if (y1 >= y2)
{
side = 1;
x1 = x2;
x2 = temp;
temp = y1;
y1 = y2;
y2 = temp;
}
for (y=y1;y<=y2;y++)
{
putpixel(x,y,color);
x1 += xslope;
}
}
This line routine does not write an entire line, but only the places where the y value changes. This result in a complete line if you draw from (0,0) to (0,10), but it also result in only one dots if you write from (0,0) to (10,1). Therefore you cannot use this as an ordinary line routine. Anyway should do the trick. Why this algorithm works as it does I wont comment at the moment, but i can assure you it works fine. Now, why should we use this line routine in the first place? yes, thats right, we need to draw lines from point to point. If you look at the above figure you can see that no matter how the triangle looks, there will allways be a point that is the lowest and one that is the highest. That means, that there allways will be one that is in the middle. Lets say now, that the line between the highest and the lowest is the mainline. In the above example the mainline is: fig1/red, fig2/blue and fig3/blue. This is because these lines are the longest. On figure one and two you can see the the middle point is left from the mainline, but on the third example it's on the right side. If we look at it this way, we have splitted our polygon up in two half's, one that is only one line, namely the mainline, and the other which goes from lowestpoint to middlepoint and back again to the highest point. Lets call the line that includes the middleline, the splitline. Note that both the splitline and the mainline ends and starts up at the same point, namely min_y and max_y. Now, what we really wanted to do with all this was to write a polygon, not just lines, so lets get to that part. To make it easier to understand we use figure three as the standart now, since it's mainline is straight and we dont have to worry about that one. What we do now is we make an array, lets call it xpos. Since a polygon can cover the entire screen we need to have [200] elements, its actually the Y position the values themself (in the array) is the X value. Lets illustate it by the following cell map:
Уважаемый посетитель!
Чтобы распечатать файл, скачайте его (в формате Word).
Ссылка на скачивание - внизу страницы.