The induction time model described by Eq. (3) predicts a linear relation between lnJ vs. 1/(lnSw)2. All the induction time data measured in this study over a rather wide range of conditions (Figs. 7–11) were found to conform reasonably well to this prediction.
The relative effectiveness of different antiscalants in suppressing the onset of CaSO4 scaling can be also analyzed by comparing slopes of the linear plots of lnJ vs. 1/(lnSw)2. The superiority of antiscalants SHMP, C and D vs. antiscalants A and B at a 6 ppm dosage is
Fig. 11. Linear correlation of induction time for SHMP runs.
Fig. 13. Linear correlation of induction time for antiscalants at 12 ppm feed dosage.
reflected in Fig. 12 by the higher values of the slopes. Fig. 13 shows that at the antiscalant dosage of 12 ppm the differences in the magnitude of the slopes are reduced, in agreement with previous observation of the effect of doubling the antiscalant dosage.
Table 5 lists surface energy values in the precipitation of CaSO4A2H2O on the membrane in the absence and in the presence of antiscalants, evaluated from the slopes of the linear correlation
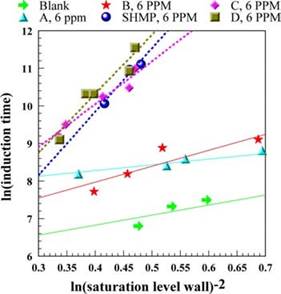
Fig. 12. Linear correlation of induction time for antiscalants at 6 ppm feed dosage.
Fig. 14. Summary of all CaSO4 literature data relating induction time with the supersaturation level.
data. Fig. 14 compares all induction time measurements reported in the literature, mostly in the absence of an antiscalant, with those measured in this study. It is clearly seen that antiscalants are able to extend considerable induction times.
The surface energy results obtained in this work (12–28 mJ/m2) are for a process of surface nucleation on a polymeric substrate under flow conditions. The closest comparison with literature results is with studies in which the induction time was governed by a surface nucleation process. The surface energy measured on a heated metal surface in the absence of anti-scalants by Linnkov [11] is Feff1 = 7.9 mJ/m2 and by Vasina [13] is Feff1 = 11.7 mJ/m2. These values are in agreement with the value Feff1 = 14.7 mJ/m2 measured in this work in the absence of an antiscalant.
It may be anticipated that the presence of an antiscalant would enhance the crystallization surface energy. The experimental data of this study (Table 5) indeed show that in most cases the antiscalant increased the surface energy from about 15 to 20–29 mJ/m2. A similar effect was reported by Vasina [13]; the antiscalant increased the surface energy from about 11 to 18–23 mJ/m2.
In conclusion, the comparison of literature data with the results measured in this study lends further support to the validity of the proposed procedure for correlating induction period data in characterizing the lower scaling threshold limit.
An important difference between the conditions present in laboratory induction time testing and the conditions prevailing in a real RO field unit lies in the flow and residence time characteristics of the two systems.
C Real RO plants operate under once-through flow conditions, thus exposing the antiscalant to a short residence time in the system. This is in contrast to the laboratory recycle technique
in which the antiscalant is exposed to a long residence time. Since every antiscalant has some adsorption capacity, a long residence time could lead to a loss of antiscalant and hence to a lower induction time than that prevailing in a real system.
C Another possible factor that could lead to a loss of antiscalant activity is the repeated pump shear stress on the antiscalant polymeric molecules present in the laboratory recycle system.
Уважаемый посетитель!
Чтобы распечатать файл, скачайте его (в формате Word).
Ссылка на скачивание - внизу страницы.