Probability Distributions
Probability Distributions
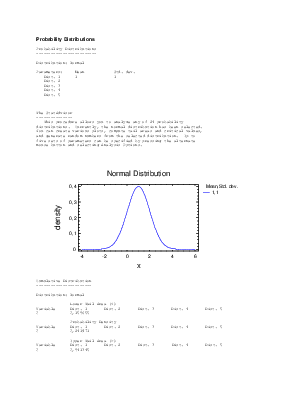
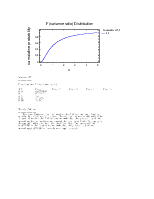
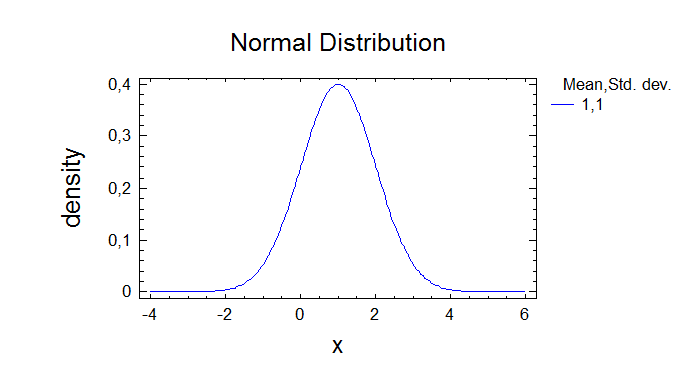
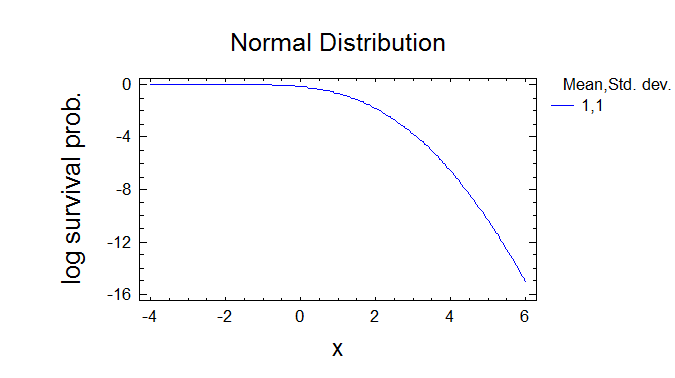
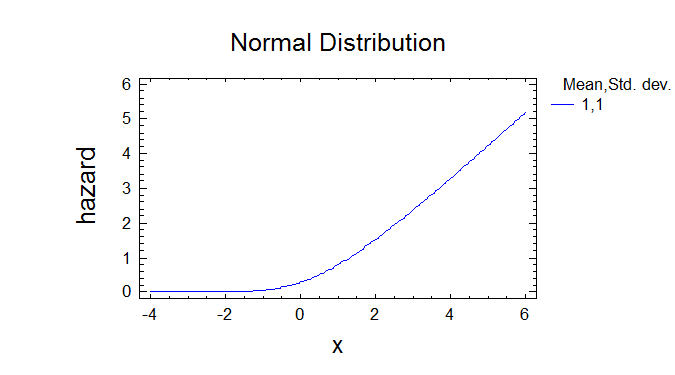
------------------------Distribution: Normal
Parameters: Mean Std. dev.
Dist. 1 1 1
Dist. 2
Dist. 3
Dist. 4
Dist. 5
The StatAdvisor
--------------This procedure allows you to analyze any of 24 probability
distributions. Currently, the normal distribution has been selected.
You can create various plots, compute tail areas and critical values,
and generate random numbers from the selected distribution. Up to
five sets of parameters can be specified by pressing the alternate
mouse button and selecting Analysis Options.
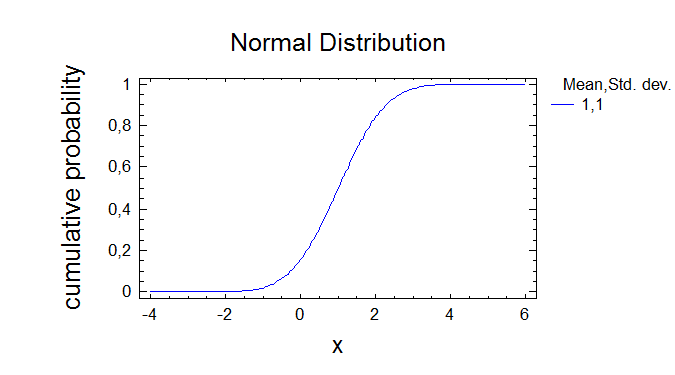
Cumulative Distribution
----------------------Distribution: Normal
Lower Tail Area (<)
Variable Dist. 1 Dist. 2 Dist. 3 Dist. 4 Dist. 5
0 0,158655
Probability Density
Variable Dist. 1 Dist. 2 Dist. 3 Dist. 4 Dist. 5
0 0,241971
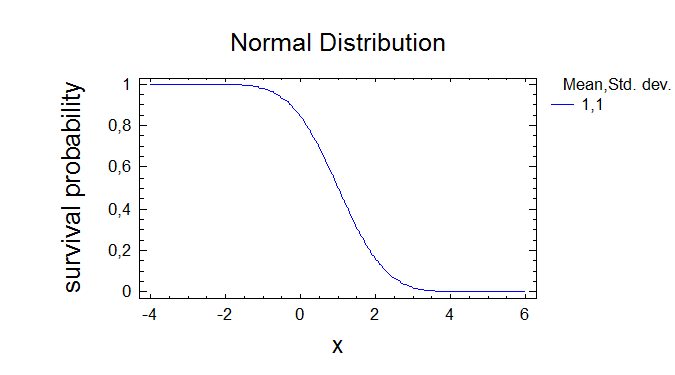
Upper Tail Area (>)
Variable Dist. 1 Dist. 2 Dist. 3 Dist. 4 Dist. 5
0 0,841345
The StatAdvisor
--------------This pane evaluates the cumulative normal distribution. It will
calculate the tail areas for up to 5 critical values of the
distribution. It will also calculate the probability density or mass
function. For example, the output indicates that, for the first
distribution specified, the probability of obtaining a value less than
0,0 is 0,158655. Also, the probability of obtaining a value greater
than 0,0 is 0,841345. The height of the probability density function
at 0,0 is 0,241971.
Inverse CDF
----------Distribution: Normal
CDF Dist. 1 Dist. 2 Dist. 3 Dist. 4 Dist. 5
0,01 -1,32635
0,1 -0,281554
0,5 1
0,9 2,28155
0,99 3,32635
The StatAdvisor
--------------This pane finds critical values for the normal distribution. You
may specify up to 5 five tail areas. The critical value is defined as
the largest value for the normal distribution such that the
probability of not exceeding that value does not exceed the area
specified. For example, the output indicates that, for the first
distribution specified, -1,32635 is the largest value such that the
probability of not exceeding -1,32635 is less than or equal to 0,01.
Random Numbers
-------------To generate random numbers from the selected distribution,
use the save button on the analysis toolbar.
Random numbers to be generated: 100
The StatAdvisor
--------------This pane allows you to specify the number of observations desired
in a random sample from the normal distribution. You set the number
of observations by pressing the alternate mouse button and selecting
Pane Options. After setting the size, press the Save Results button
on the analysis toolbar. This allows you to save random samples from
the specified distribution in columns of the current data file. Every
time you select Save Results, a new random sample will be generated.
Probability Distributions
Probability Distributions
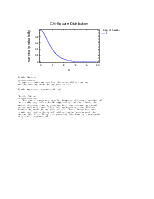
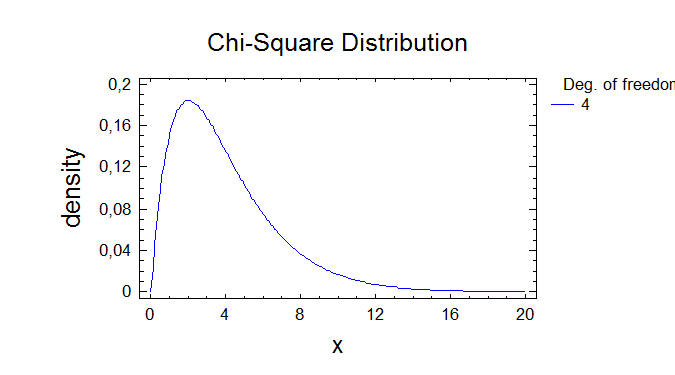
------------------------Distribution: Chi-Square
Parameters: Deg. of freedom
Dist. 1 4
Dist. 2
Dist. 3
Dist. 4
Dist. 5
The StatAdvisor
--------------This procedure allows you to analyze any of 24 probability
distributions. Currently, the chi-square distribution has been
selected. You can create various plots, compute tail areas and
critical values, and generate random numbers from the selected
distribution. Up to five sets of parameters can be specified by
pressing the alternate mouse button and selecting Analysis Options.
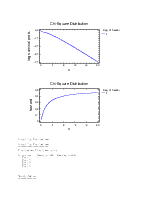
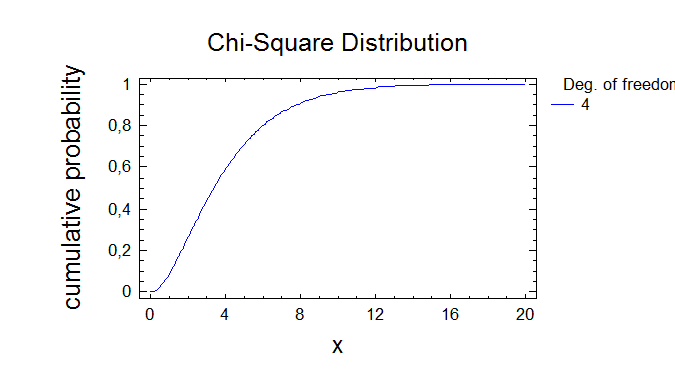
Cumulative Distribution
----------------------Distribution: Chi-Square
Lower Tail Area (<)
Variable Dist. 1 Dist. 2 Dist. 3 Dist. 4 Dist. 5
0 0,0
Probability Density
Variable Dist. 1 Dist. 2 Dist. 3 Dist. 4 Dist. 5
0 0,0
Upper Tail Area (>)
Variable Dist. 1 Dist. 2 Dist. 3 Dist. 4 Dist. 5
0 1,0
The StatAdvisor
--------------This pane evaluates the cumulative chi-square distribution. It
will calculate the tail areas for up to 5 critical values of the
distribution. It will also calculate the probability density or mass
function. For example, the output indicates that, for the first
distribution specified, the probability of obtaining a value less than
0,0 is 0,0. Also, the probability of obtaining a value greater than
0,0 is 1,0. The height of the probability density function at 0,0 is
0,0.
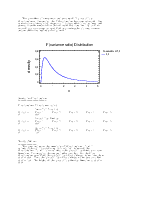
Inverse CDF
----------Distribution: Chi-Square
CDF Dist. 1 Dist. 2 Dist. 3 Dist. 4 Dist. 5
0,01 0,297109
0,1 1,06362
0,5 3,35669
0,9 7,77944
0,99 13,2767
The StatAdvisor
--------------This pane finds critical values for the chi-square distribution.
Уважаемый посетитель!
Чтобы распечатать файл, скачайте его (в формате Word).
Ссылка на скачивание - внизу страницы.