Figure 11
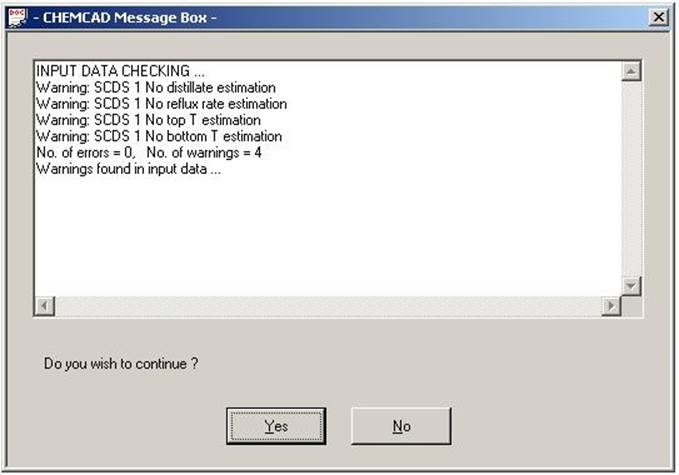
7.3 Should an error or additional warnings be displayed; this will need to be addressed on a separate basis.
8. Running Simulation
8.1 Click on the “R” in the upper left corner to run the simulation.
8.2 After it has finished, each stream number may be clicked on to view the final compositions.
9. Results
9.1 Double click on Stream 2 and type “Distillate” for the stream name.
9.2 Double click on Stream 3 and type “Bottoms” for the stream name.
9.3 To set the units of each stream for the results, click on the “Results” tab at top, and choose “Set Flow Units”. Choose mole fractions for the flow units.
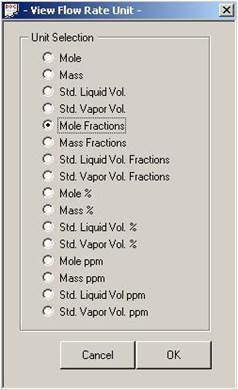
Figure 12
9.4 Click “OK” to continue.
9.5 To generate a report of various types of results, click on “Results” on the top menu bar, follow the drop down to the preferred selection A diagram is given below:
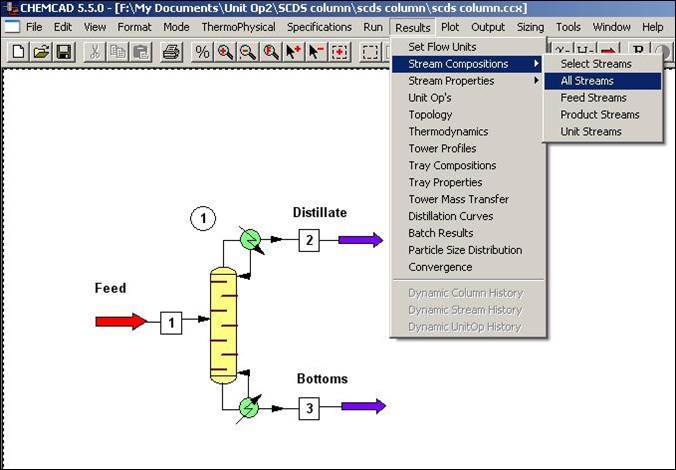
Figure 13
9.6 The results are generated in a word pad document. Results for the “Stream Compositions” are displayed below:
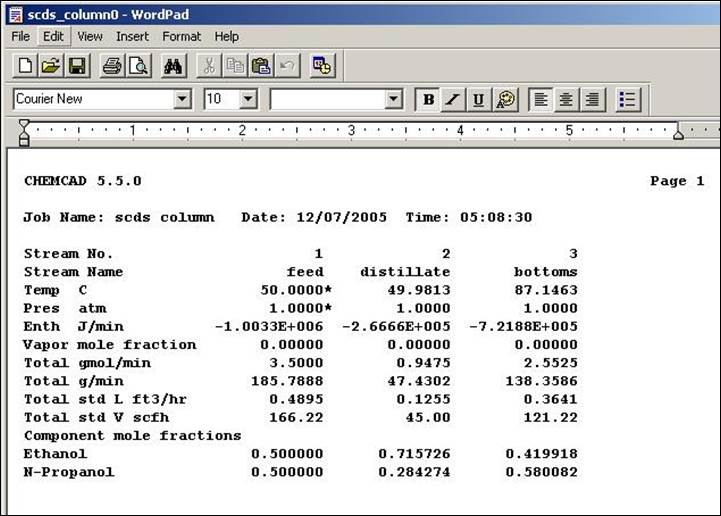
Figure 14
9.7 When requesting the remaining types of results, make sure to specify the unit operation number for the corresponding results. Results for the “Unit Op’s” are displayed below:
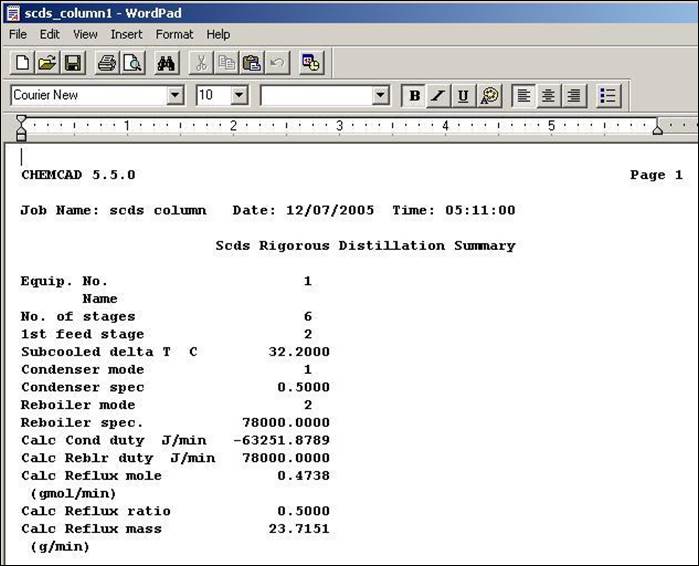
Figure 15
9.8 Results for the “Tower Profiles” are displayed below:
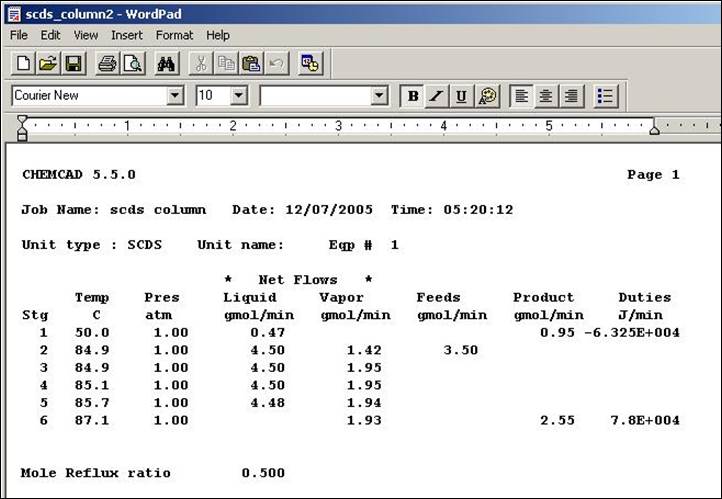
Figure 16
9.9 Results for the “Tray Compositions” are displayed below:
CHEMCAD 5.5.0 Page 1
Job Name: scds column Date: 12/07/2005 Time: 05:24:24
Unit type : SCDS Unit name: Eqp # 1
Stage # 1 49.98 C 1.00 atm
V Mole frac L Mole frac Y/X
Ethanol 0.00000 0.71573 0.00000
N-Propanol 0.00000 0.28427 0.00000
Total gmol/min 0.0000 0.4738
Stage # 2 84.89 C 1.00 atm
V Mole frac L Mole frac Y/X
Ethanol 0.71573 0.54656 1.30951
N-Propanol 0.28427 0.45344 0.62693
Total gmol/min 1.4213 4.5018
Stage # 3 84.94 C 1.00 atm
V Mole frac L Mole frac Y/X
Ethanol 0.71238 0.54242 1.31334
N-Propanol 0.28762 0.45758 0.62856
Total gmol/min 1.9494 4.4999
Stage # 4 85.14 C 1.00 atm
V Mole frac L Mole frac Y/X
Ethanol 0.70298 0.53087 1.32419
N-Propanol 0.29702 0.46913 0.63314
Total gmol/min 1.9475 4.4955
Stage # 5 85.69 C 1.00 atm
V Mole frac L Mole frac Y/X
Ethanol 0.67663 0.49941 1.35485
N-Propanol 0.32337 0.50059 0.64598
Total gmol/min 1.9430 4.4837
Stage # 6 87.15 C 1.00 atm
V Mole frac L Mole frac Y/X
Ethanol 0.60448 0.41992 1.43951
N-Propanol 0.39552 0.58008 0.68184
Total gmol/min 1.9313 2.5525
Figure 17
9.10 Results for the “Tray Properties” are displayed below:
CHEMCAD 5.5.0 Page 1
Job Name: scds column Date: 12/07/2005 Time: 05:26:15
Unit type : SCDS Unit name: Eqp # 1
LIQUID Actual Actual Thermal Surface
Average vol rate density viscosity conduct. tension
Stg g/min mol wt ft3/hr lb/ft3 cP Btu/hr-ft-F dyne/cm
1 24 50.06 0.07 47.95 0.7918 0.091 20.451
2 236 52.43 0.68 45.98 0.4678 0.085 17.719
3 236 52.49 0.68 45.98 0.4681 0.085 17.723
4 237 52.65 0.68 45.98 0.4685 0.085 17.727
5 238 53.09 0.68 45.98 0.4695 0.085 17.738
6 138 54.21 0.40 45.97 0.4711 0.084 17.758
Stg Liq H
J/min
1 -1.3333e+005
2 -1.2618e+006
3 -1.2617e+006
4 -1.2615e+006
5 -1.261e+006
6 -7.2188e+005
VAPOR Actual Actual Thermal
Average vol rate density viscosity conduct. Compr.
Stg g/min mol wt ft3/hr lb/ft3 cP Btu/hr-ft-F factor
1 0 0.00 0 0.0000 0.0000 0.000 0.000
2 71 50.06 86 0.1088 0.0102 0.012 0.978
3 98 50.10 119 0.1089 0.0102 0.012 0.978
4 98 50.24 119 0.1091 0.0102 0.012 0.978
5 98 50.60 118 0.1098 0.0101 0.012 0.977
6 100 51.62 118 0.1115 0.0101 0.012 0.977
Stg Vap H
J/min
1 0
2 -3.3674e+005
3 -4.6196e+005
4 -4.6182e+005
5 -4.6161e+005
6 -4.6114e+005
Figure 18
Уважаемый посетитель!
Чтобы распечатать файл, скачайте его (в формате Word).
Ссылка на скачивание - внизу страницы.