VLE FOR BINARY MIXTURES
Problem Statement:
For the binary mixture of ethanol and n-propanol, generate the vapor-liquid equilibrium data (in SI units) and the plots using CHEMCAD (both at a constant temperature of 298 K and at a constant pressure of 1atm) for each of the following K-Value methods:
Compare the results from all the four methods.
Procedure:
Step 1: Entering the components and engineering units
Step 2: Selection of K-Value method
Step 3: Generating TPXY plots and retrieving results
NOTE:
Only the procedure for NRTL method is discussed here. The procedure is the same for other K-values methods too.
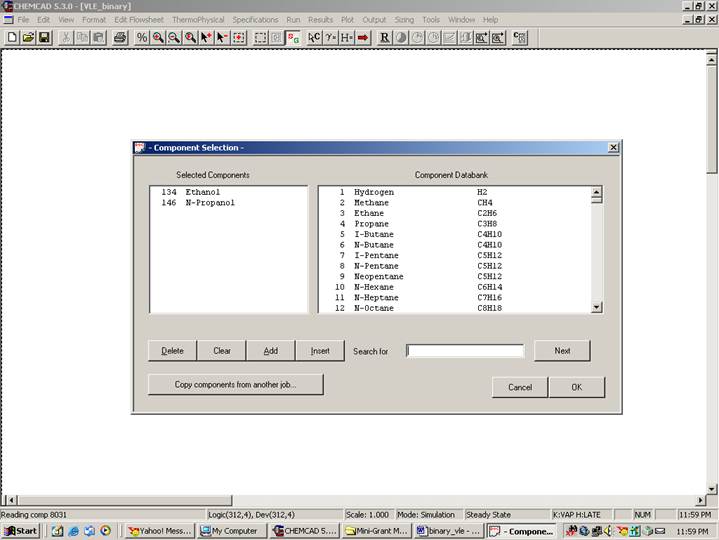
Go to new on the File menu and save the blank simulation. Go to the Thermophysical on the menu bar and click on Components List. Find ethanol and n-propanol from the CHEMCAD components list and add them to the component list. Go to the Format menu and click on Engineering Units and select the desired units for such properties as temperature, pressure etc. Click OK to continue.
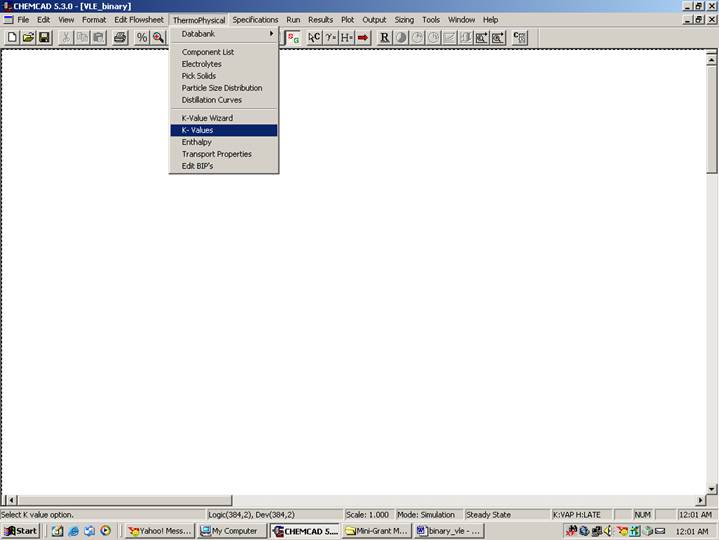
Go to Thermophysical on the menu bar and click on K-Values. Select NRTL from the list located under Global K-Value Option. On the bottom right hand side, check the box corresponding to Clear all local K-Values/BIP’s. This will clear any previous K-Value methods set for the unit operations (if any) within the simulation. The remaining fields in this window can safely be ignored. (This step is exactly the same when other K-Value methods are selected under Global K-Value Option)
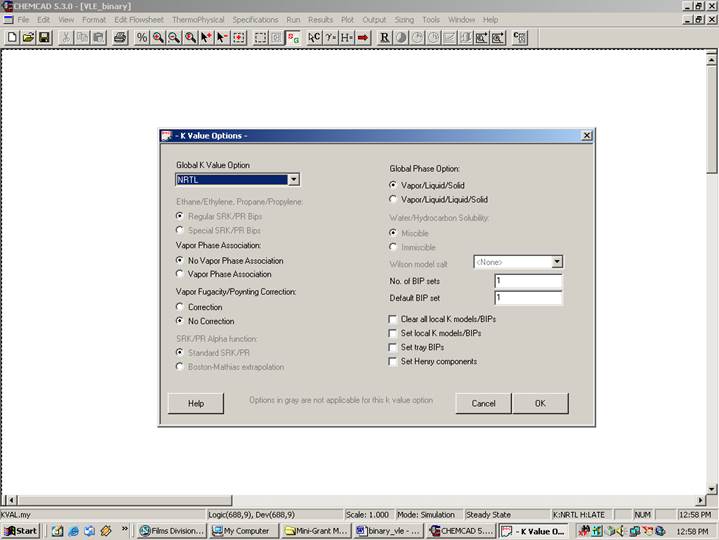
Click on Ok to continue. The following window will appear.
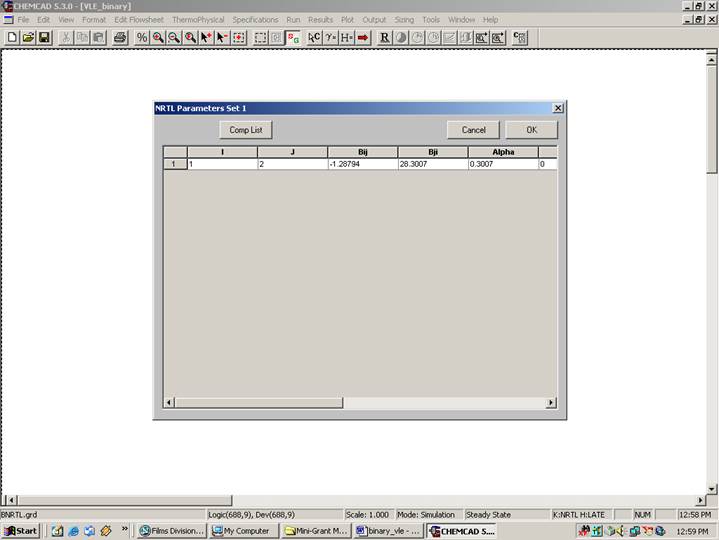
This table indicates the BIP’s corresponding to the NRTL method. Click on OK to continue.
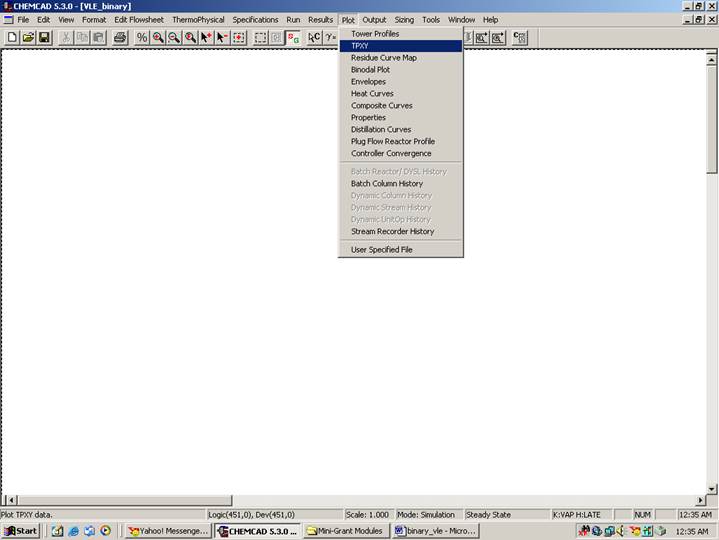
Step 3: Generating TPXY plots and retrieving results
Go to Plot on the menu bar and select TPXY.
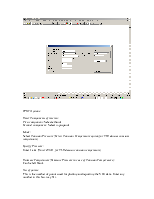
The following window appears.
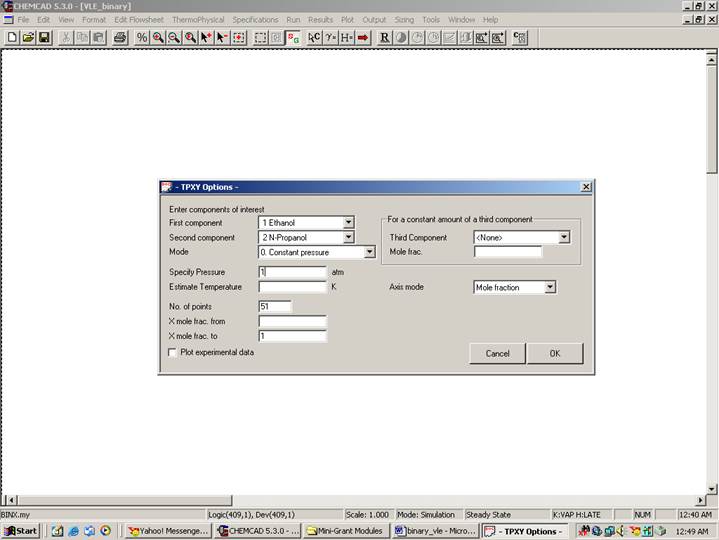
TPXY Options:
Enter Components of interest:
First component: Select ethanol
Second component: Select n-propanol
Mode:
Select Constant Pressure (Select Constant Temperature option for VLE data at constant temperature)
Specify Pressure:
Enter 1 atm (Enter 298 K for VLE data at constant temperature)
Estimate Temperature(Estimate Pressure in case of Constant Temperature):
Can be left blank
No. of points:
This is the number of points used for plotting and reporting the VLE data. Enter any number in this box (say 51).
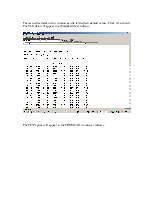
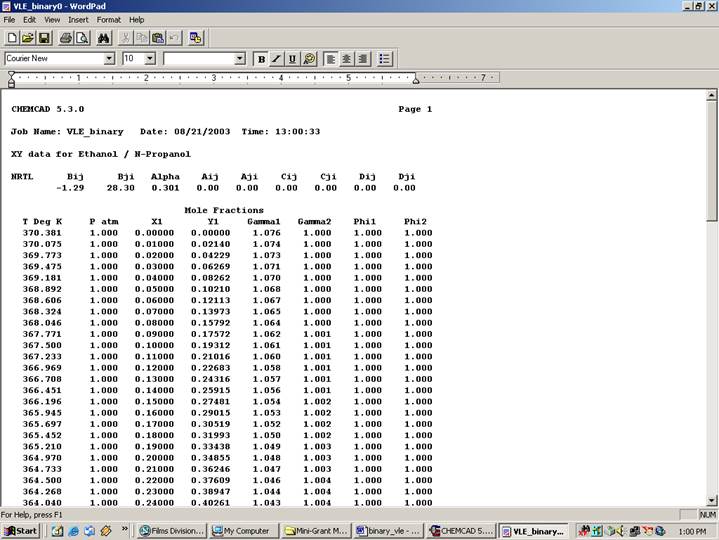
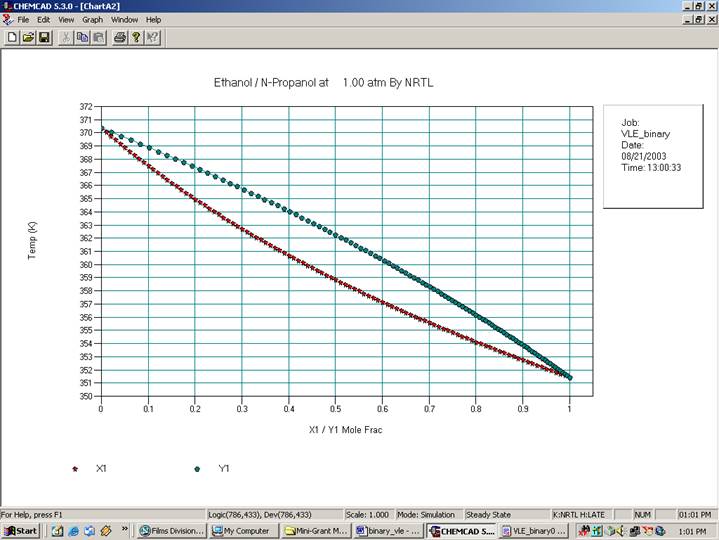
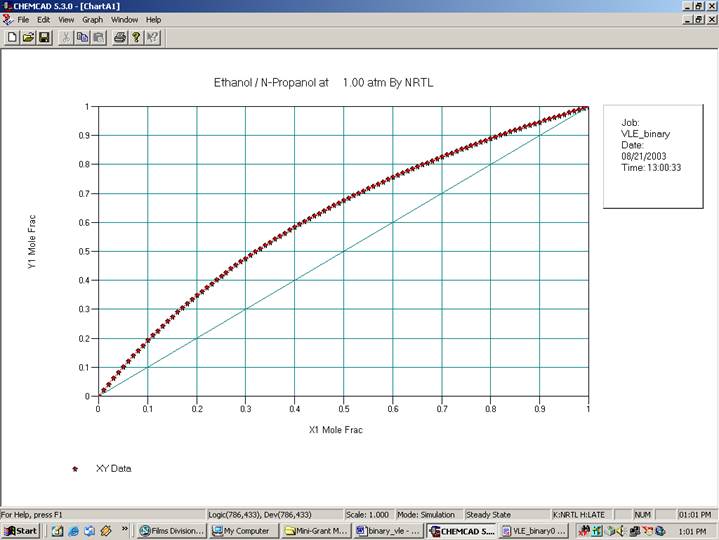
The rest of the fields in this window can be left to their default values. Click Ok to finish. The VLE data will appear in a WordPad file as follows:
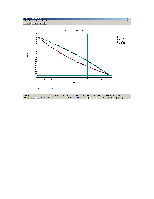
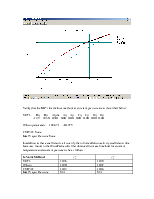
The TPXY plots will appear in the CHEMCAD window as follows:
Verify that the BIP’s for the four methods at constant pressure are as described below:
NRTL Bij Bji Alpha Aij Aji Cij Cji Dij Dji
-1.29 28.30 0.301 0.00 0.00 0.00 0.00 0.00 0.00
Wilson parameters: 102.671 -40.875
UNIFAC None
Ideal Vapor Pressure None
In addition to these coefficients, also verify the infinite dilution activity coefficients (the Gammas, found in the WordPad results file) obtained from each method for constant temperature and constant pressure to be as follows:
|
K-Value Method |
|
|
|
NRTL |
1.076 |
1.078 |
|
Wilson |
1.070 |
1.087 |
|
UNIFAC |
1.012 |
1.016 |
|
Ideal Vapor Pressure |
N/A |
N/A |
Note:
Subscript ‘1’ in the Gammas stand for ethanol. In other words, ![]() stands for the infinite dilution activity
coefficient for ethanol. This value is the first value shown in the column
under Gamma1 in the WordPad file. Similarly,
stands for the infinite dilution activity
coefficient for ethanol. This value is the first value shown in the column
under Gamma1 in the WordPad file. Similarly, ![]() is the
last value shown in the column under Gamma2 in the WordPad file.
is the
last value shown in the column under Gamma2 in the WordPad file.
Уважаемый посетитель!
Чтобы распечатать файл, скачайте его (в формате Word).
Ссылка на скачивание - внизу страницы.